Clarity Grid Blog
Insights and analysis of the electric grid, wholesale prices, and the electricity markets.
First Quarter 2022 PNode Additions
As the Electric Grid changes and new sources of generation and load appear, Independent System Operators (ISOs) react by accommodating supply and demand through the interconnection process which receives much attention from Market Participants. Some projects make their way through the siting and approval process, and some do not. However, one of the most significant...
Behind the Meter Battery Calculator
Battery Installation Growth Projections One of the most significant trends in the evolution of electric grids throughout the world of late has been the rapid deployment of energy storage using advancing battery technology improvements. With the prices for Utility scale battery projects forecast to fall to $100/kWh by 2023 from the...
Breaking Down Demand Charges
Tariff Categories- When Electric Utilities look to craft their rate structures (tariffs) to submit for their State’s Public Utility Commission approval, they seek to cover costs and earn a rate of return for various types of services. First, they must ensure they have a monthly revenue stream regardless of whether they deliver a large amount of power, or none at all. ...
Time of Use Electricity Tariffs
Electric Distribution entities across the US of all types (IOUs, Municipals, Cooperatives, and Government Agencies) have adopted similar pricing structures to serve their customers within their franchise service territories. These “tariffs” typically incorporate some type of fixed monthly cost ($), distribution cost by monthly volume ($/kwh), demand charge for peak...
Top 20 – 2021 Battery Locations in ERCOT
We took another look at the most profitable locations for a one-hour battery over the past year (excluding the craziness going on in February!). One region we did not expect dominated the top 20 locations. Register for the Clarity Grid mailing list below to get the full report and any future reports, blogs and news from Clarity Grid. Register for the Clarity Grid...
First Half of 2021 Nodal Updates
First Half of 2021 Nodal Updates For years economists and other market researchers, suspicious of official government statistics, have watched Chinese electric consumption figures to more accurately gauge economic growth. The thinking being that such figures as power consumption by industry sector or city was a more reliable indicator of what was happening in the “real...
Clarity Grid releases its Nodal Library
Clarity Grid Solutions maintains a library of over 8,500 Tariffs from over 1,500 individual Distribution Utilities serving the lower 48 US States. Since distribution territory is typically defined by zip code these tariff sets are accessible on Clarity GIS Bing Maps GIS according to this mapping. However, we have also made this library available through a Tariff Library...
Tackling YOUR energy Bill….what YOU can do about it
Utility companies all over the United States have been utilizing energy tariffs to conduct business. But what are they? Energy tariffs are how energy providers charge you for your gas and electricity use. They generate your bill according to how much energy you use, and make their money once the bill is paid. Many energy providers can raise prices whenever they want, so...
Texas Power Prices: How bad was it?
With the press reporting customers in Texas reeling from power bills, in some cases over $10,000, how bad did it get for the average customer in ERCOT on wholesale billing? How bad would it have been for customers in Texas outside of ERCOT had they contracted for power off wholesale prices? While SPP and MISO serve parts of Texas their pricing remains regulated...
Nodal Network Updates
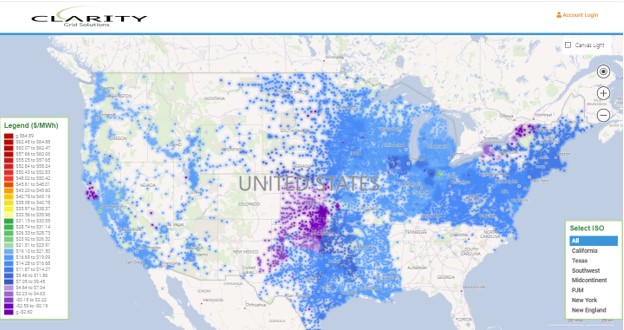
Clarity maintains and updates a complete set of pricing for over 70,000 individual locational prices in the US. This is commonly referred to as “nodal prices” in the electric industry jargon. Nodal pricing typically comes in two varieties: “Load” and “Generation”. In simplistic terms “Load” pricing occurs at a substation or “bus” and “Generation” pricing occurs at the...

