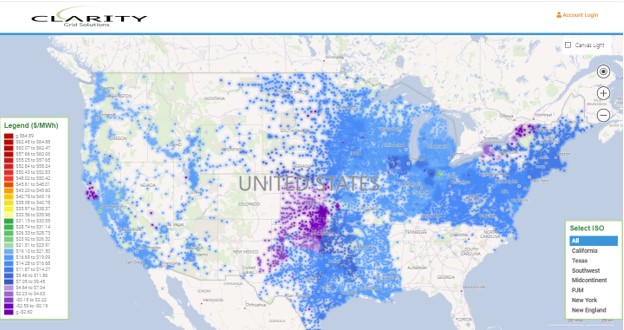
As the Electric Grid changes and new sources of generation and load appear, Independent System Operators (ISOs) react by accommodating supply and demand through the interconnection process which receives much attention from Market Participants. Some projects make their way through the siting and approval process, and some do not. However, one of the most significant phases for any new construction on the Grid is the assignment of a Price Node or PNode by the ISO regulatory authorities. This can indeed occur before any visual satellite evidence of the facility can be seen, or even prior to energy or services being taken from, or provided to the Grid. Still, this is an important designation in the life of the facility (substation or generation) indicating that a unique price for the value of energy is now being published as a result of the ISO SCED (Security Constrained Economic Dispatch) process which produces a Locational Marginal Price (LMP) for the physical location.
Clarity PNode Additions
Because the economic and physical structure can best be understood beginning at PNode layer, the current composition of the Load and Generation pricing and location is of great interest to a wide assortment of Grid Stakeholders, renewables developers, marketers and traders, DER developers, and even EV charging infrastructure developers. Therefore, we spend a great deal of effort at Clarity Grid mapping not only the existing set of grid elements but also adding those which appear on a continuing basis through the data feeds of each respective US ISO. Recently a major factor in PNode additions has been the inclusion of an entire Utility’s grid infrastructure as is becomes a member of an existing ISO, most notably CAISO’s Energy Imbalance Market (EIM) which this quarter introduced Load and Gen points for Tacoma Power and Avista Energy in the Northwestern US. In the case of Avista the totals were 180 Load and 34 Generation nodes, and for Tacoma 244 Load and 21 Generation. Below is a Table showing the additions to our existing PNode database since the beginning of 2022.
| Load Gen |
| NYISO 0 0 |
| NEISO 4 4 |
| PJM 199 25 |
| SPP 58 53 |
| ERCOT 233 31 |
| CAISO 512 108 |
| Totals 1,006 221 |
New Generation Additions by Fuel Type (Storage)
While the construction new substations and addition of existing ones (substations can exist which are not tracked with PNodes), the most dramatic and important additions to the Grid have occurred on the generation side. As environmental concerns take hold, large what have been called “central station” power plants, chiefly coal-fired, have been shut down and new renewable energy charged generation has taken hold closer to points of consumption or, “Grid Edge” generation. This trend gained momentum as 2022 began with large amounts of new solar, wind and battery being granted PNode status. Notably amongst this across ISOs was the addition of 6,687 mws of Wind in SPP, and 2,251 mws of Solar in CAISO. Significantly bucking this trend was MISO which added over 10 thousand mws of natural gas fired generation, chiefly with the introduction of generation from Entergy’s J Wayne Leonard Power Station in Louisiana, and the Blue Water Energy Center in Michigan owned by Detroit Edison. In terms of battery storage, only ERCOT, PJM and CAISO recorded any meaningful additions, Notable amongst these was Wartsila’s 100 mw facility in Mission, TX called Madero Grid, and the 150 mw Arroyo Battery project in PNM’s service territory and tied to the Arroyo Solar’s 300 mw generation facility. Below is a table of additions of generation based upon PNode activity by fuel and ISO:
| NYISO | NEISO | PJM | MISO | SPP | ERCOT | CAISO | Totals | |
| Solar | 0.0 | 0.0 | 1,673.7 | 1,165.2 | 0.0 | 1,827.0 | 2,251.7 | 6,917.6 |
| Hydro | 0.0 | 38.6 | 2.2 | 700.0 | 647.0 | 0.0 | 5,814.1 | 7,201.9 |
| Natural Gas | 0.0 | 330.0 | 1,765.3 | 10,137.0 | 2,741.6 | 8,779.9 | 2,157.5 | 25,911.3 |
| BM | 0.0 | 0.0 | 0.0 | 0.0 | 4.8 | 0.0 | 183.4 | 188.2 |
| Battery | 0.0 | 0.0 | 67.8 | 1.2 | 0.0 | 211.0 | 479.0 | 759.0 |
| Wind | 0.0 | 0.0 | 346.2 | 1,617.0 | 6,686.7 | 1,775.6 | 264.4 | 10,689.9 |
| Coal | 0.0 | 0.0 | 0.0 | 0.0 | 325.0 | 0.0 | 0.0 | 325.0 |
| Distillate | 0.0 | 250.0 | 0.0 | 31.0 | 132.0 | 50.0 | 15.0 | 478.0 |
| Generation | 51,711.9 | |||||||
| Storage | 759.0 |
It should be noted that additions to the Chart totals may not necessarily indicate new generation brought onto the Grid but existing generation being assigned LMP pricing due to the governing Utility (LBA) joining an ISO. For example, the additions of Tacoma Power and Avista Energy is virtually the sole reason for the large additions of hydro in the CAISO area.
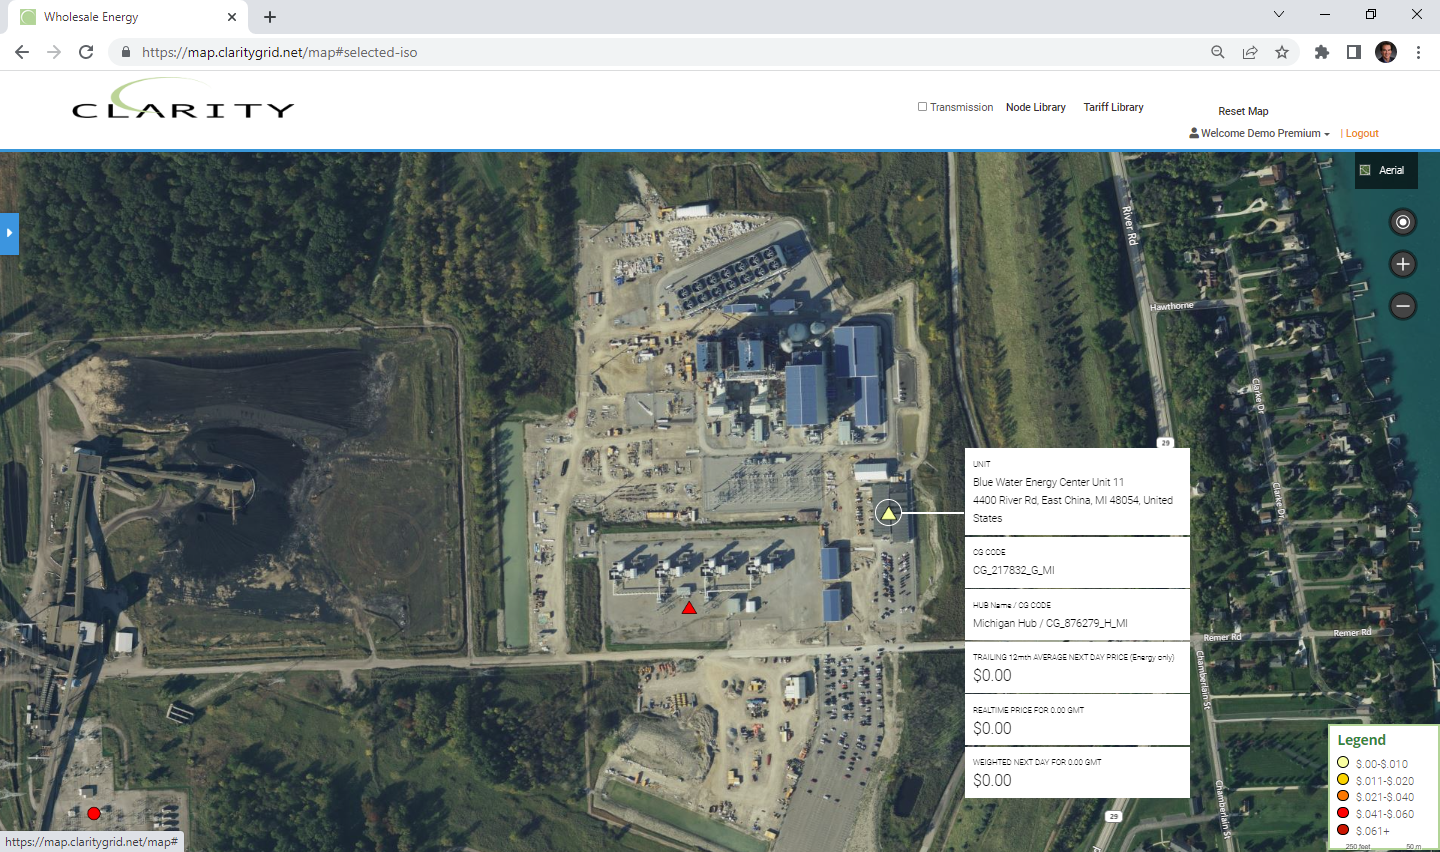
Screen shots from Clarity’s User Interface for notable additions to generation are shown below:
Detroit Edison’s new 1,150 mw Blue Water Energy Center
Wartsila’s 100.54 mw Modero Grid Battery Storage Facility (adjacent to Sharyland’s 138 kv Railroad substation), not yet visible from satellite:

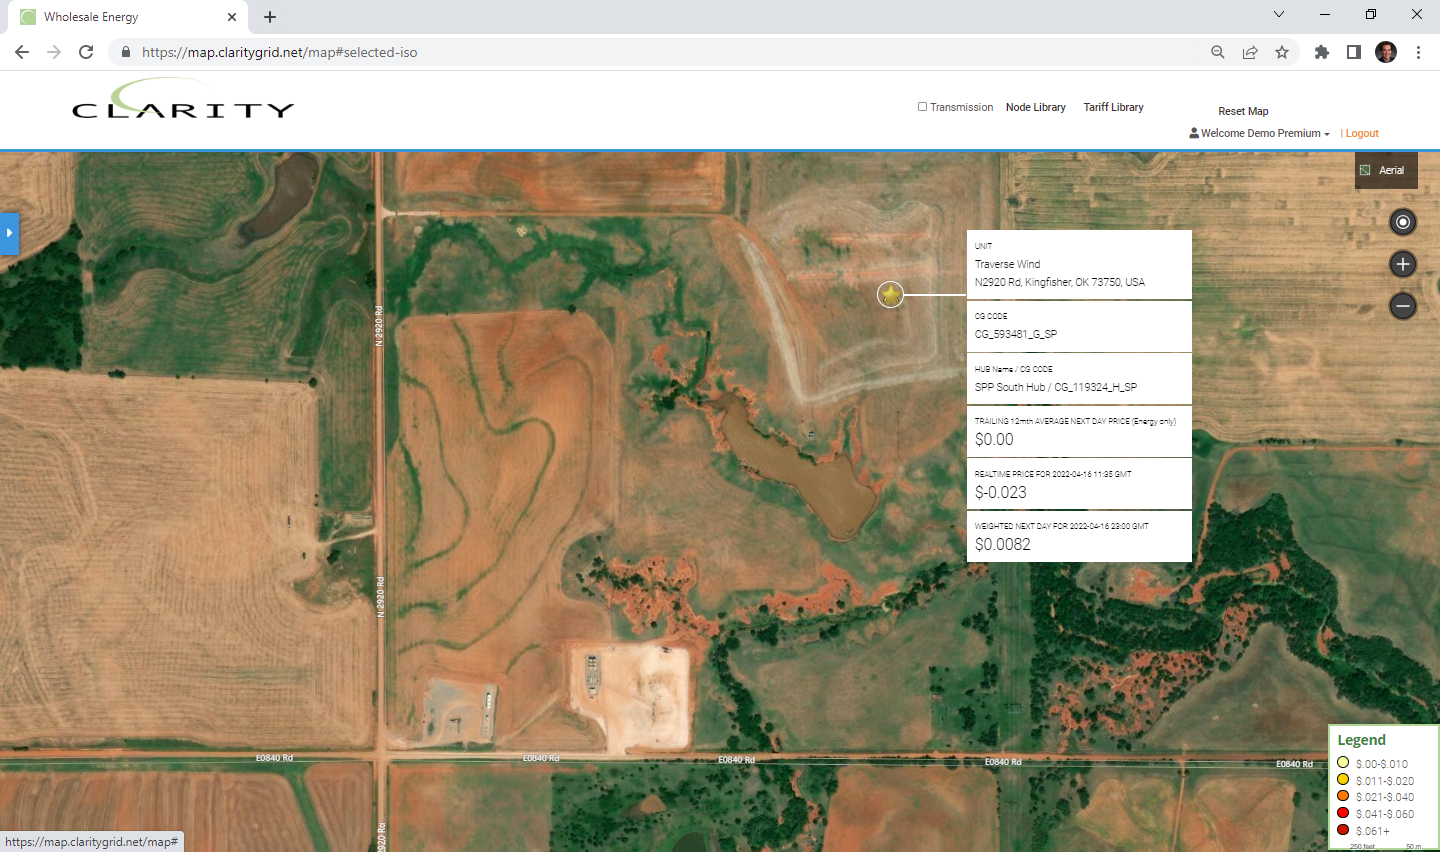
Invenergy’s 999 mw Traverse Wind in Kingfisher OK (not yet visible)
New Load (Substations):
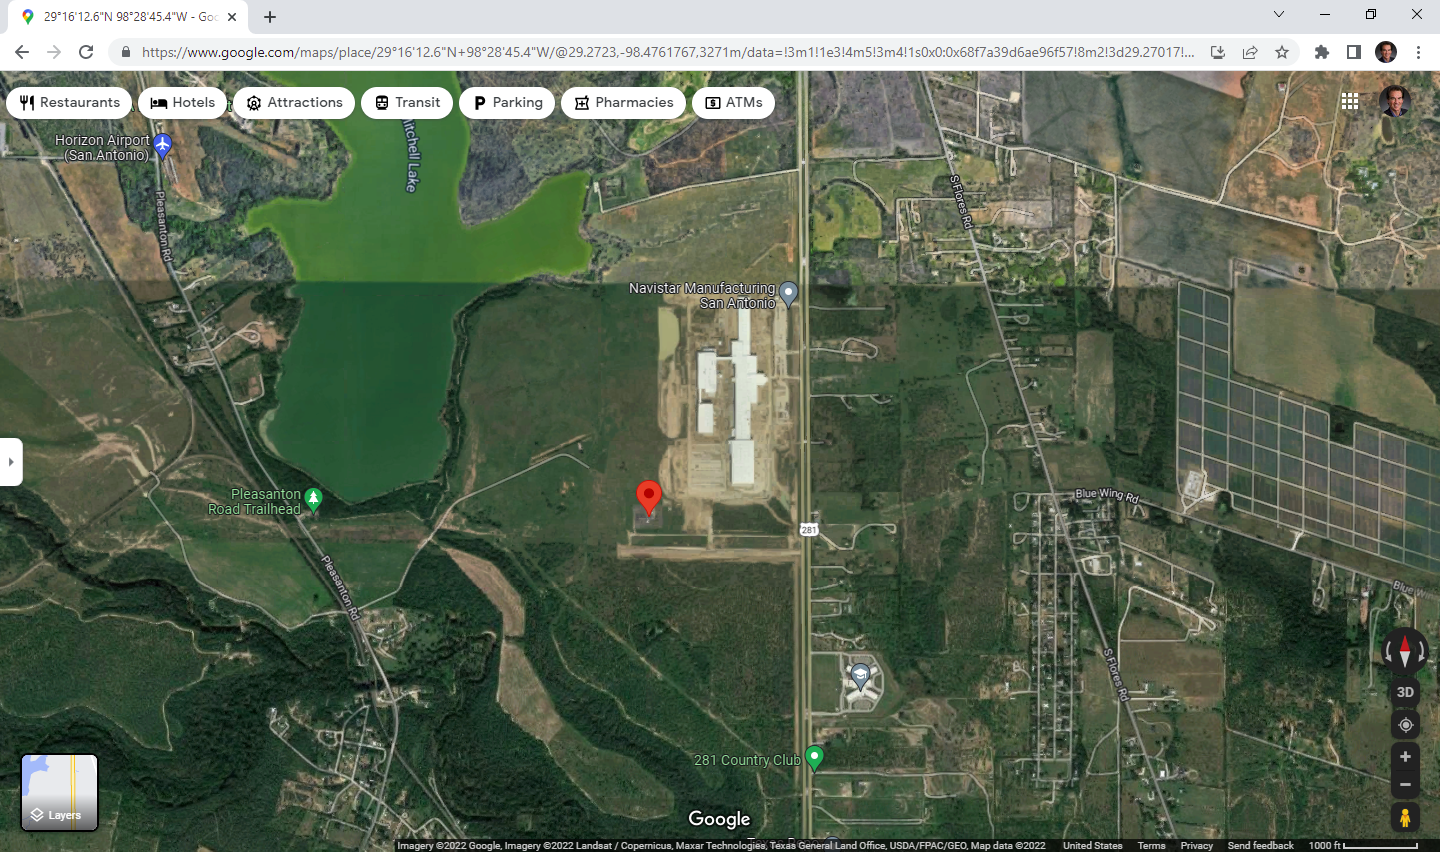
In terms of scale the population of Pnodes for Load outnumber those for Generation by approximately 6 to 1. So, for any given update far more Load nodes are added than for Gen, also new Generation is almost always accompanied by the addition of substations which will have Load Nodes added to them. As noted above CAISO had the newest PNodes added for Load mostly due the inclusion of substations tied to the Tacoma and Avista networks. The capacities of the substations added can also vary from transmission level (345kv) to distribution level subs (34.5 kv or lower). One of the interesting, related pieces of intelligence which comes from tracking PNode additions as it indicates where economic activity is growing, either through new distribution substations tied to residential or small commercial growth, or due to large singular facilities requiring service appear on the map. Notable this quarter were Load node additions for a new Navistar Plant south of San Antonio:
CPS Navistar, San Antonio, TX (Clarity website (not visible)/Google Maps)

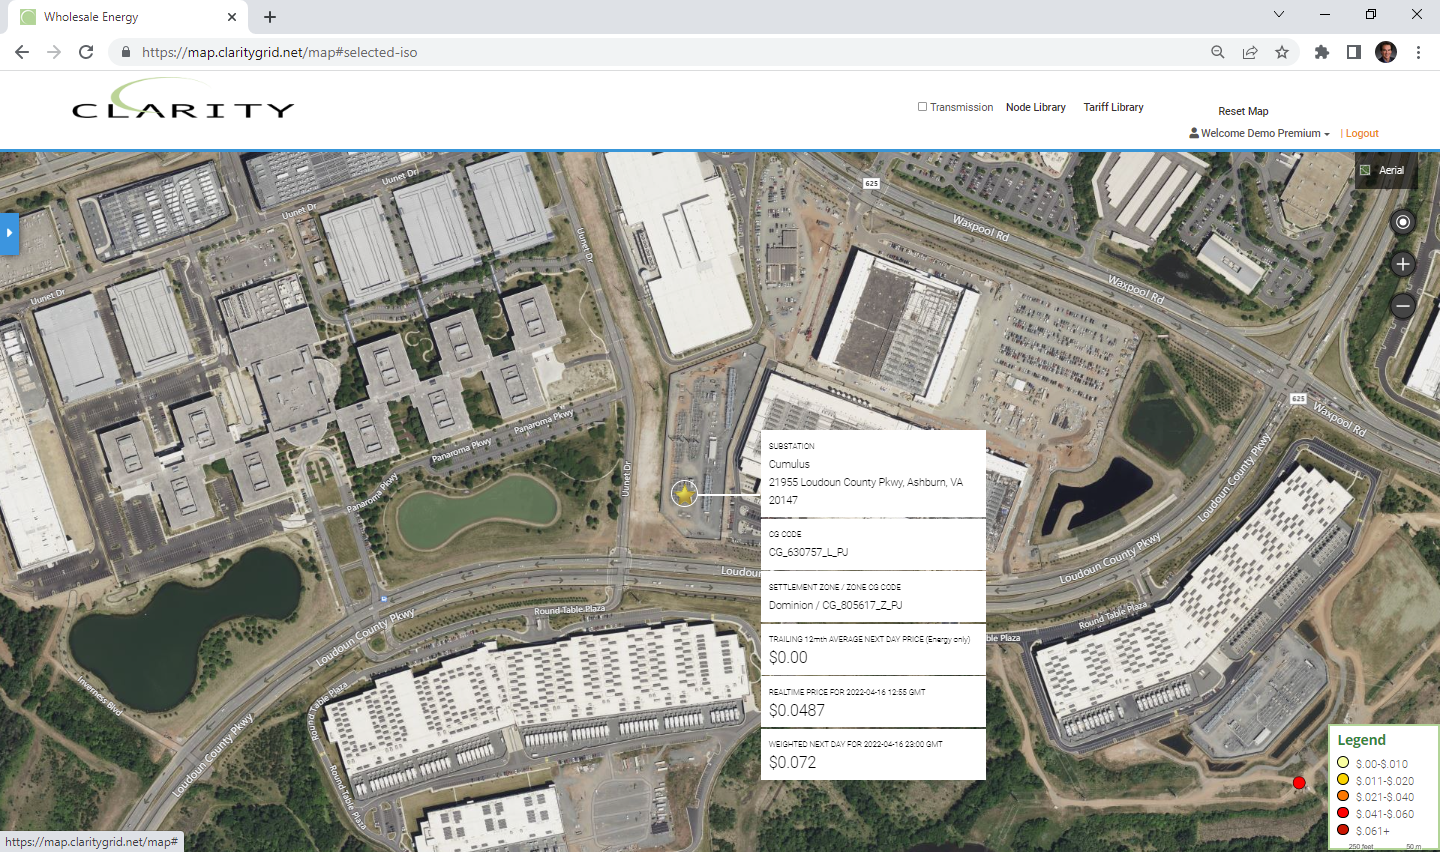
Dominion’s new Cumulus 230kv substation servicing the CloudHQ Data Center:
Amongst the new substations Tacoma Power substations is Blair a 230 kv substation in the Port of Tacoma:

If you are interested in viewing all existing and new load and gen facilities, please inquire about a trial at https://www.claritygrid.net and select “Request a Demo.”