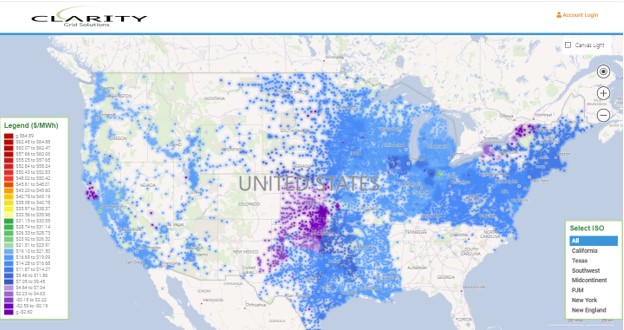
Clarity maintains and updates a complete set of pricing for over 70,000 individual locational prices in the US. This is commonly referred to as “nodal prices” in the electric industry jargon. Nodal pricing typically comes in two varieties: “Load” and “Generation”. In simplistic terms “Load” pricing occurs at a substation or “bus” and “Generation” pricing occurs at the physical point of electricity production. These prices are presented visually Clarity’s platform using a Bing Maps GIS format with accompanying meta-data which helps provide a context for the pricing. These include capacity, anchor load name, and utility ownership for Load, and capacity, ownership, and fuel type for Generation.
Several factors cause the tracking and display of prices throughout the US Electric Grid difficult and largely unavailable on an open access basis. The formats in which the data is provided by each of the Independent System Operators (ISOs) is cryptic and non-standard across ISOs. In addition, much of the easily interpreted data (maps) is labeled “Critical Energy Infrastructure Information” (CEII) and available only under NDA. Lastly, the tracking of each individual price for Load on the system is often considered unnecessary as most consumers do not pay the nodal price. Rather each of these nodal prices is used to create a weighted average price across a region which creates a “Settlement Zone”, “Index”, or “Zonal” price. HUB pricing also is commonly referred to as a benchmark pricing consisting of weighted average prices for consumers.
Despite this there is real value in identifying the pricing for consumers at specific physical locations “Load” nodes. By tracking and updating physical locations for pricing industry participants get real insights into what is driving pricing in a region which can affect costs that consumers ultimately pay through congestion or system upgrade charges. Distributed Generation developers can identify points where above market returns can be made through interconnection of new generation or storage. Those involved in demand response programs can identify points where reduction in load is acutely needed. Lastly, even those not involved in the electric industry can glean insights into the changing nature of economic activity as old sources of demand are retired (Manufacturing) and new sources are introduced (Data Centers, Fulfillment Warehouses, etc.).
Clarity has been aggregating complete sets of nodal data over several years and displaying on our platform without NDA restrictions. By reviewing pricing trends for existing Load and Generation, as well as updating the view for new substations and generating sources key insights can be derived. Not surprisingly we have seen a dramatic increase in new solar facilities, particularly in the New Jersey, Delaware, and California areas. In addition, several Utility Scale Battery installations are now receiving pricing and visible on Clarity’s site. On the consumption side we have seen conversions of formerly retail commercial sites to Amazon Fulfillment centers, while large Data Center facilities have been added in Oregon, Iowa, and Virginia. Large scale manufacturing plants have also been added in Louisiana, Texas, and Pennsylvania (see below).
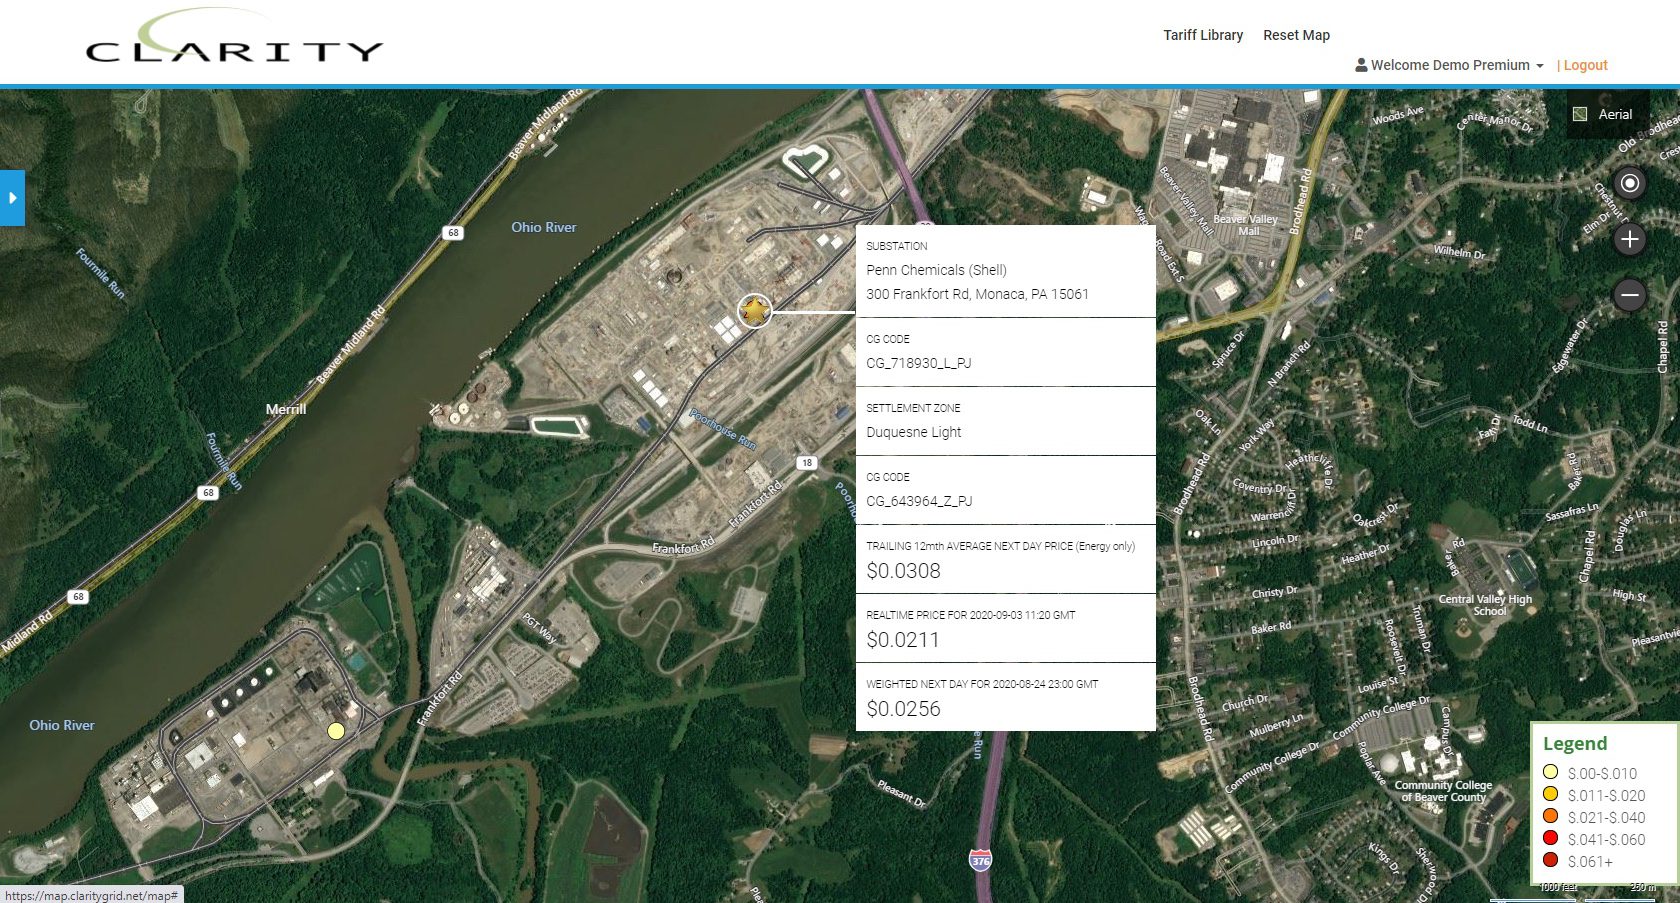
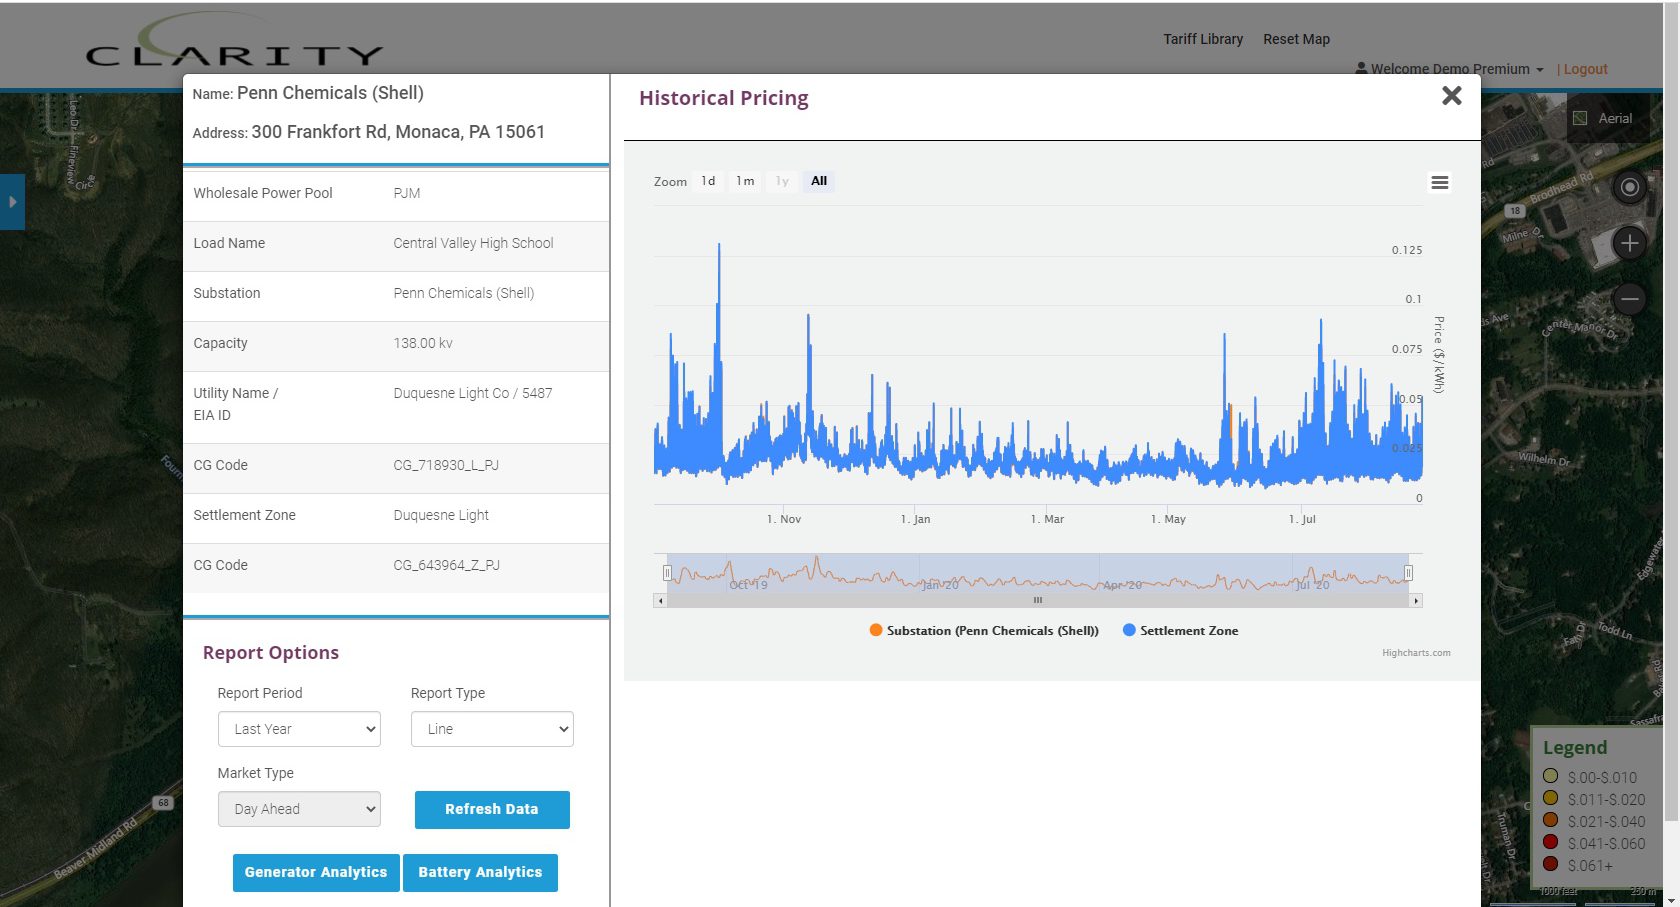
Shell’s massive petrochemical plant in Monica, PA required 138 kv substation additions by Duquesne Light Co.
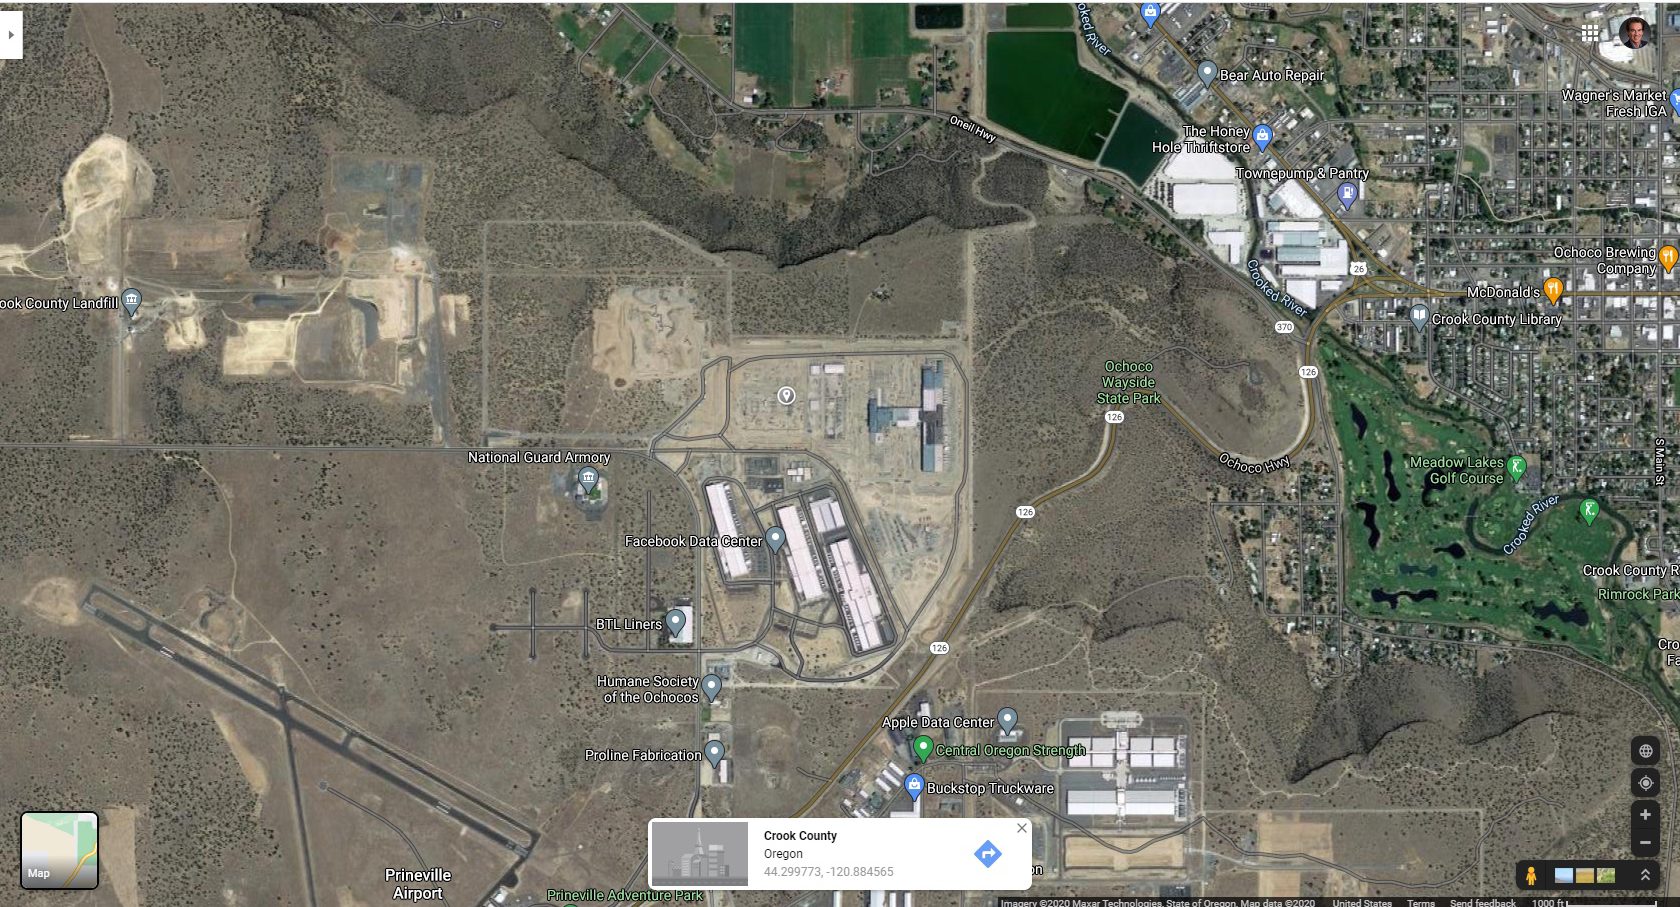
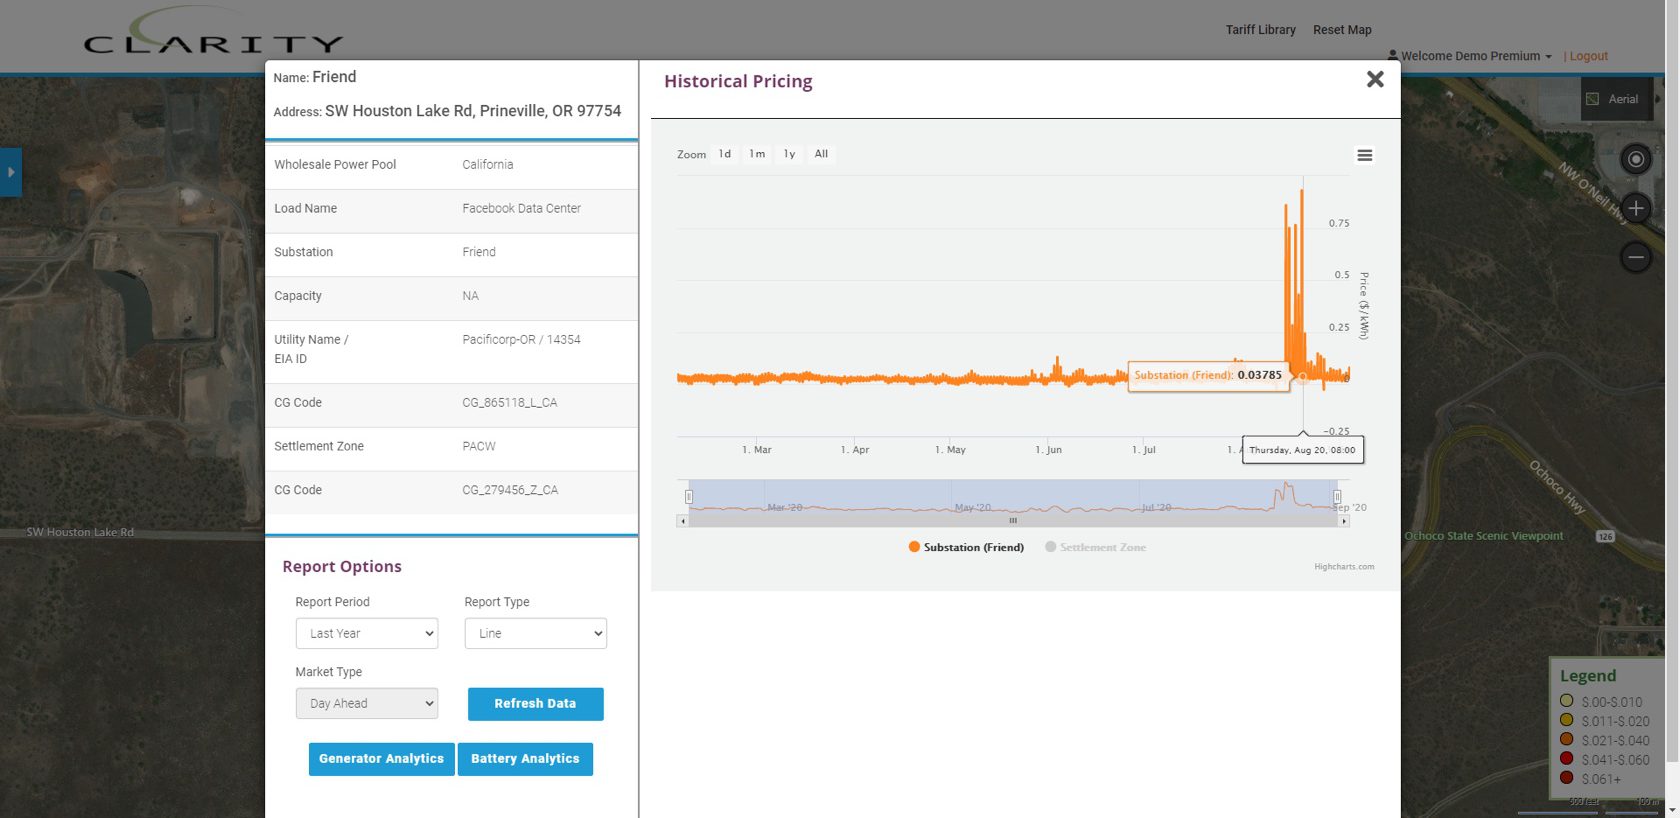
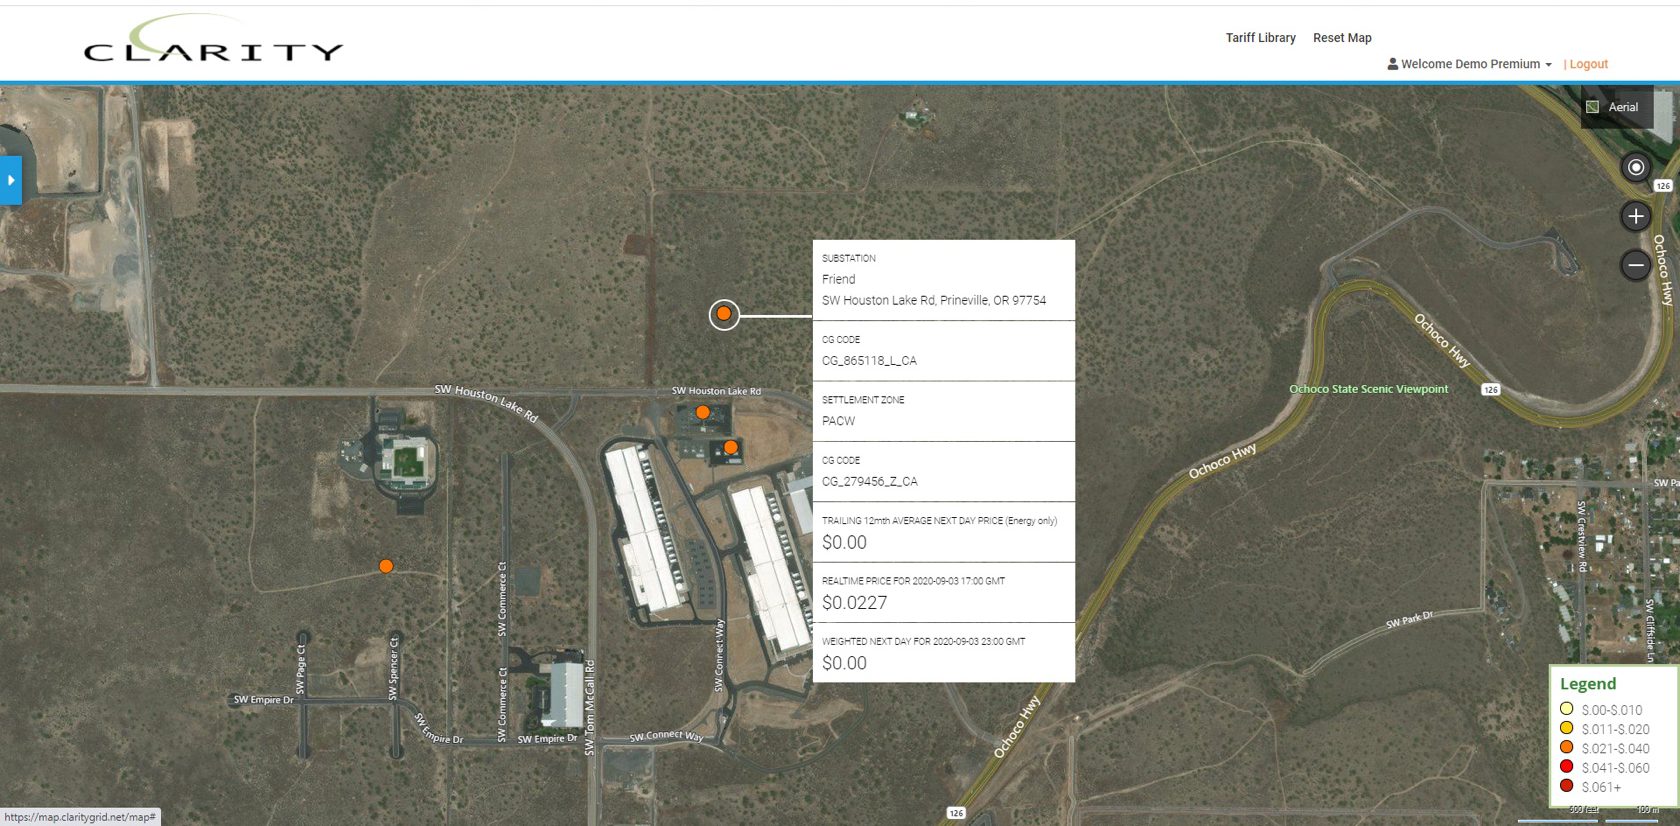
New Facebook Data Center “Friend” in Prineville, OR with Pacificorp 138 kv substation, (visible using Google Maps).
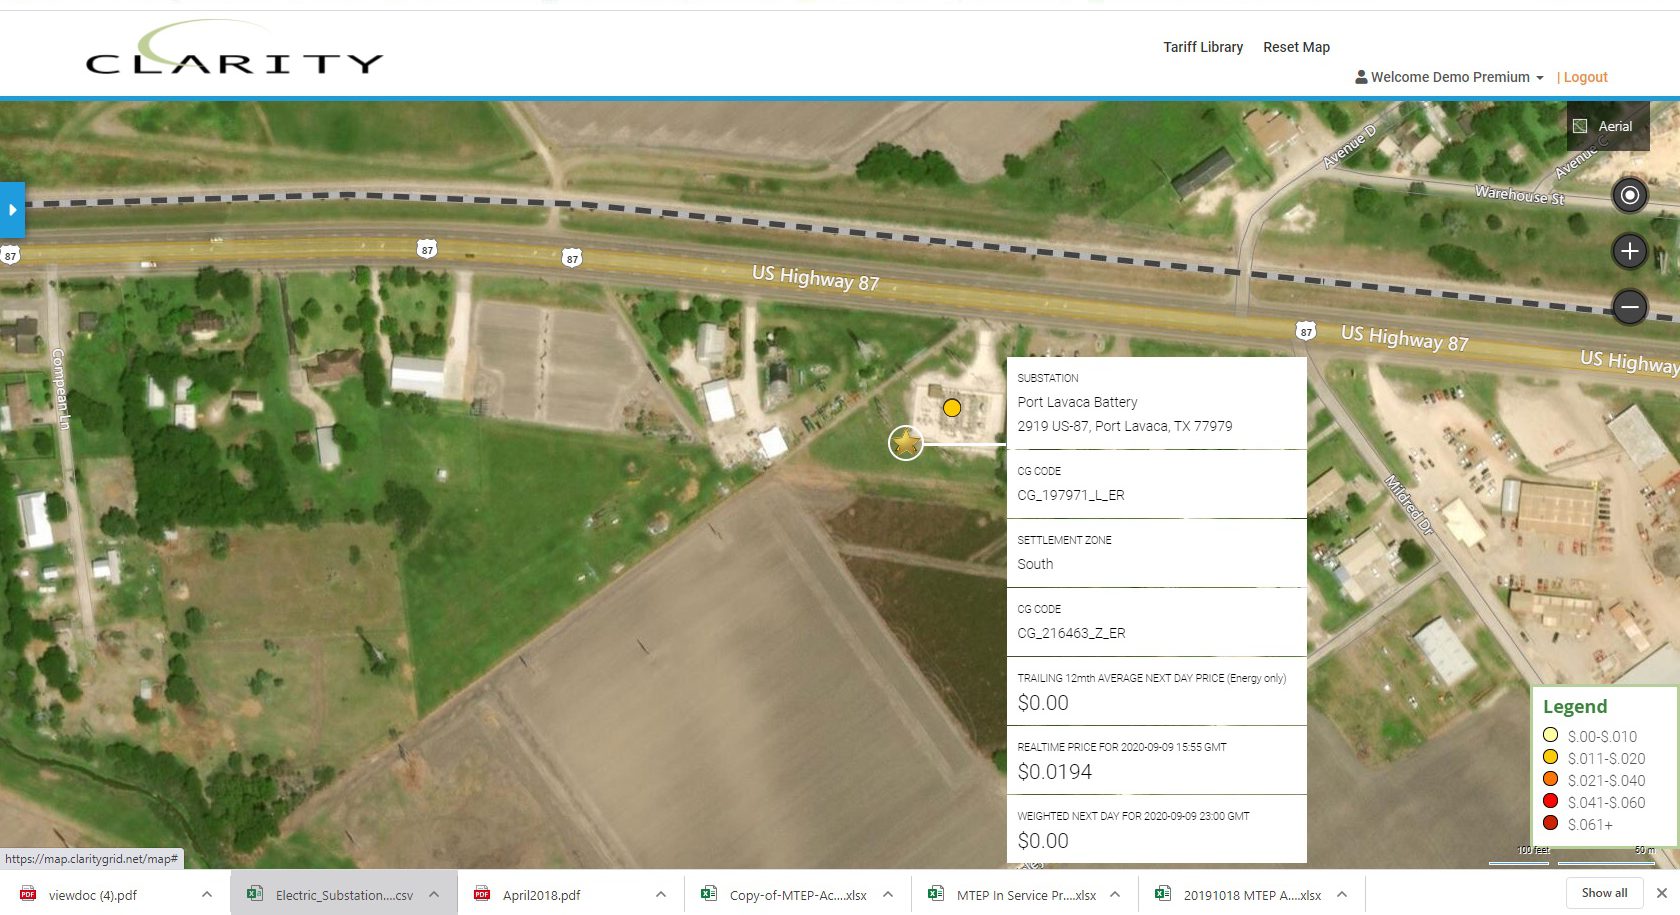
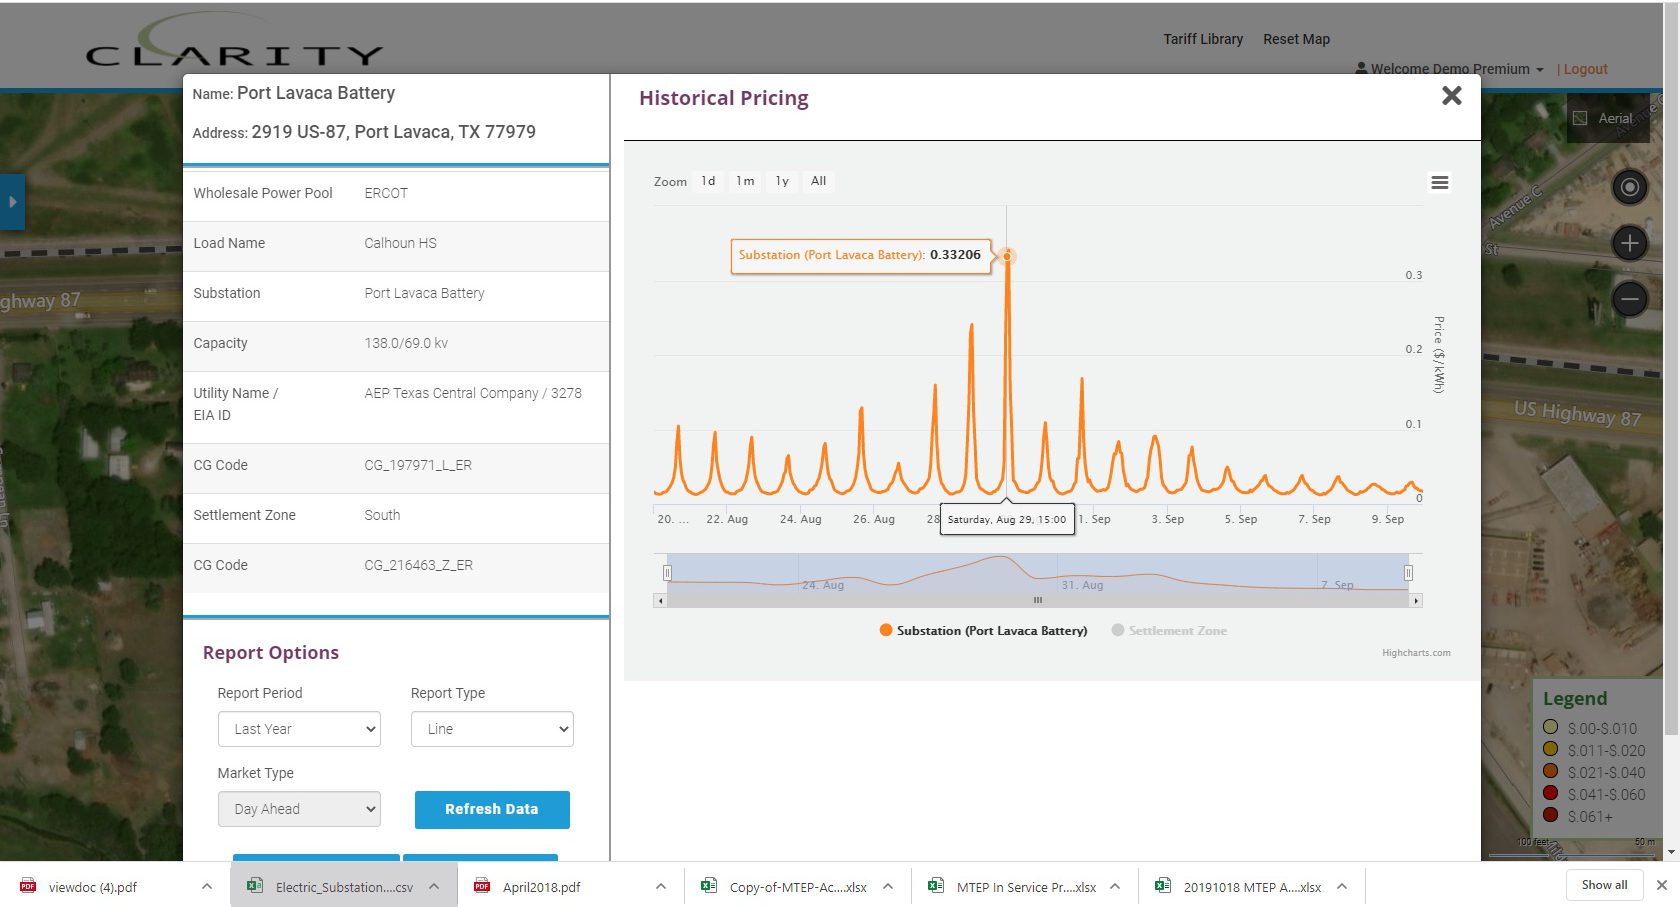
View of estimated location of Key Capture’s 9.9 mw Port Lavaca Battery Project in Calhoun County, TX with pricing, just south of AEP’s Port Lavaca’s 138.00 kv substation.
All 70,000 locations with associated data are viewable on Clarity Grid Solutions platform. Please contact Sarah Thomas at sathomas@claritygrid.net for a Demo and free 2-week trial.

