Executive Summary
ISO PNode counts for the 7 US ISOs increased by 172 Generation nodes and 631 Load nodes during the first Quarter of 2024. Total Node count for all 7 US ISOs is over 80k for the first time. Of these total 80,214 nodes, 67,518 are for Load, 11,265 are for Generation, 194 are for HUB, and 1,237 are for Load Zones.
In aggregate, the 7 US ISOs added 12,330 mws of Generation and 3,678 of Battery capacity during the 1st Quarter of 2024 based on tracking Nodal count additions. These numbers are consistent with prior periods and reflect marginal PNode additions largely driven by activity in CAISO and ERCOT as seen from Chart 1 below.

Background
Clarity Grid Solutions has been aggregating Nodal Coordinate data for the 7 US Independent Service Operators (ISOs) since 2016 in support of Grid-based development, power trading, and interconnection support, amongst other grid-stakeholders. Since location is a diver of the value of power, and distributed generation at the Grid level is now more feasible, capturing locational and price data, supported with metadata, is essential to support the development and operations of the current and future Electric Grid.
Nodal locations break down into two primary categories: Load (Substation/Bus) and Generation (Gen) which includes traditional thermal or hydro generators, but also renewable resources such as Wind or Solar. Utility scale Batteries (Storage) are categorized as Generation although they are in fact hybrid resources incorporating both Load and Gen elements. Included in the Nodal output captured from the ISOs are aggregated price indices which fall into the category of sets of Load Nodes in a fixed geographic area (Zones) and Generation Resources (HUBs). Clarity also matches all Nodes which are locationally specific to the appropriate Zone or HUB based upon ISO distinctions which is referred to as Commercial Model relationship mapping.
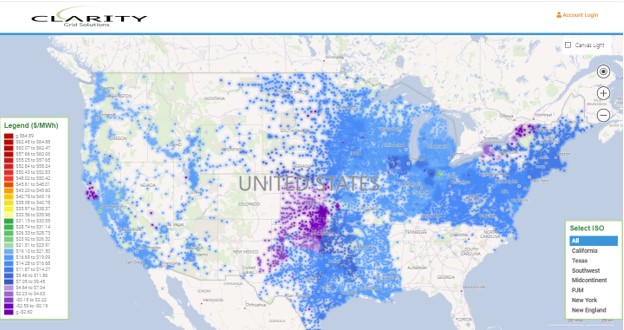
While the movement of electrons from one nodal point to another (transmission) is an important part of the settlement of power transactions through the ISOs, the pricing of these transactions is done though a separate process and platform referred to as OASIS. Therefore, by combining nodal coordinate and price data powerful visualizations of the infrastructure and economics of the US Electric Grid can be created (See Example below)
Clarity PNode Additions
Unlike other research sources reviewing changes to the Grid, Clarity focuses exclusively on the addition (or removal) of Price Nodes reported daily by each of the US ISOs. While a new Price Node may not represent a currently active substation, generator, or battery, it is the necessary precursor to its introduction. While all generators/batteries are required to have a PNode assigned, as this is how they are paid through settlement, Load (Substations/Buses) prices may form only one part of a broad Index upon which payment is required and therefore these are not completely covered by the ISOs. Although not complete, the vast majority of Substations/Buses (90-95%) are assigned PNodes.
Not all regions of the US are currently covered by ISOs, notably absent are the Southeastern US and Florida in the East and significant parts of the Western US, formerly known as WECC. However, ISO coverage has been growing significantly over the last 5 years as both California (CAISO) and SPP have added new Utility systems to their membership, specifically CAISO EIM and SPP WEIS extended markets. Therefore, Clarity’s PNode counts may change for 4 principal reasons: 1) PNodes may be assigned to previously existing substations, 2) PNodes may be added as a new Utility System is added to an ISO and its Generation and Load Nodes are incorporated into the ISO, 3) Additional capacity (transformers/generation units) being added to preexisting locations, or 4) Truly new Generators or Substations are added to the Grid infrastructure. It is the last category which we focus on most as this represents new additions to the Grid.
The distinction between newly added and truly new additions can be seen by comparing the 2 Charts below:
Chart 2
1Q 2024 Notional Node Additions
| NYISO | NEISO | PJM | MISO | SPP | ERCOT | CAISO | Total Fuel Type | |
| Solar | 5 | 0 | 28 | 11 | 1 | 4 | 29 | 78 |
| Hydro | 3 | 0 | 1 | 0 | 1 | 0 | 0 | 5 |
| Natural Gas | 8 | 0 | 2 | 1 | 2 | 1 | 8 | 22 |
| BM | 0 | 0 | 0 | 0 | 0 | 0 | 0 | 0 |
| Battery | 1 | 0 | 0 | 2 | 0 | 14 | 30 | 47 |
| Wind | 3 | 0 | 6 | 0 | 2 | 2 | 3 | 16 |
| Coal | 0 | 0 | 0 | 2 | 0 | 0 | 0 | 2 |
| Distillate | 1 | 0 | 1 | 0 | 0 | 0 | 0 | 2 |
| Geothermal | 0 | 0 | 0 | 0 | 0 | 0 | 0 | 0 |
| Total ISO | 21 | 0 | 38 | 16 | 6 | 21 | 70 | 172 |
| NYISO | NEISO | PJM | MISO | SPP | ERCOT | CAISO | Total Load | |
| Load | 0 | 1 | 175 | 115 | 38 | 254 | 48 | 631 |
Chart 3
1Q 2024 Newly Constructed Node Additions
| NYISO | NEISO | PJM | MISO | SPP | ERCOT | CAISO | Total Fuel Type | |
| Solar | 3 | 0 | 28 | 11 | 1 | 4 | 26 | 73 |
| Hydro | 0 | 0 | 1 | 0 | 0 | 0 | 0 | 1 |
| Natural Gas | 1 | 0 | 0 | 0 | 0 | 1 | 8 | 10 |
| BM | 0 | 0 | 0 | 0 | 0 | 0 | 0 | 0 |
| Battery | 0 | 0 | 0 | 2 | 0 | 14 | 30 | 46 |
| Wind | 2 | 0 | 4 | 0 | 1 | 2 | 1 | 10 |
| Coal | 0 | 0 | 0 | 0 | 0 | 0 | 0 | 0 |
| Distillate | 0 | 0 | 0 | 0 | 0 | 0 | 0 | 0 |
| Geothermal | 0 | 0 | 0 | 0 | 0 | 0 | 0 | 0 |
| Total ISO | 6 | 0 | 33 | 13 | 2 | 21 | 65 | 140 |
| NYISO | NEISO | PJM | MISO | SPP | ERCOT | CAISO | Total Load | |
| Load | 0 | 0 | 39 | 40 | 5 | 101 | 3 | 188 |
As can be seen from a comparison of the 2 Charts, while nodal additions grew by 771 (631Load and 140 Gen), newly constructed nodal points only registered 328 (188 Load and 140 Gen), compared to 273 (192 Load and 81 Gen in the previous Quarter). This was due to most additions to Load occurring due either to: the addition of PNodes to pre-existing infrastructure in all ISOs or the mapping of existing locations without PNodes (Buses) to a newly created PNode.
Newly Constructed Load Nodes
In reviewing newly constructed substations over the Quarter the majority of the 101 Nodes built to serve load in ERCOT were constructed in conjunction with new Wind, Solar, Natural Gas, and Battery facilities. Outside of some smaller capacity facilities in South Texas, all new large Load facilities entailing multiple PNode additions were tied to new, mostly renewable, generation facilities in relatively desolate areas of Texas.
Despite clear indications of consumer load growth in ERCOT, 40,000 Mw or almost 50% by 2030, virtually all infrastructure to serve load was built to inject into the Transmission Grid and not co-located with consumption at the Distribution level. This necessary reliance upon the transmission grid does show some signs of ending, particularly in West Texas. While PNode additions do not equate directly to fixed levels of load-serving capacity, the pace of new PNode Load additions from one quarter to the next does not seem to indicate growth in capacity needed to serve projected load growth (see Chart 1). In contrast to ERCOT, most of the forty new Load Nodes in MISO and the thirty-nine new PJM Load additions were tied directly to large new loads, such as Data Centers or Manufacturing facilities. All other ISOs registered insignificant Load additions as seen in Chart 3.
Newly Constructed Generation (Storage) by Fuel Type
As shown in Chart 4. Generation additions over the Quarter were dominated by Solar, registering 9,235 mws in the first Quarter of 2024 compared to 6,116 mws during the last Quarter of 2023. For example, PJM recorded no solar additions in the 4th quarter of 2023, but registered 2,474 mws of new capacity in the first quarter of 2024. This impressive addition slightly exceeds MISO Solar additions, and trailed only CAISO’s 2,939 mws.
Although Wind additions have trailed off after major construction in prior years, new facilities still added 1,767 mws of capacity to the Total ISOs Grid during the Quarter. Rounding things out the opening of a large natural gas facility in Utah. as well as a new Natural Gas fired generation facility in ERCOT combined to contribute 1,329 mws of thermal generation additions overall. On the Battery (Storage) side both CAISO and ERCOT continued to dominate with CAISO adding 2,380 mws and ERCOT 1,193 mws with minor additions also registering in MISO.
Chart 4
Newly Constructed Generation and Storage (mw) 1st Q 2024

Noteworthy Examples of Load Additions:
PJM
In contrast to what had been sluggish growth in new generation facilities, PJM has continued to add large new loads with accompanying substation capacity over the last several Quarters, with 1st Quarter 2024 being no exception. In Dominion territory alone three new data center facilities came online, from a PNode perspective, serving Microsoft and Google operations (see below Dominion’s new 230 kv Altair Substation and new Microsoft Data Center under construction).

MISO
While data center growth drove load serving capacity additions in PJM, it was large manufacturing and urban load growth which dominated MISO infrastructure additions. MISO is both the largest and most geographically diverse of the ISOs, running south from the northern Canadian border Great Lakes states down the Mississippi to Louisiana. As a result, this ISO serves a wide variety of industries served within its territory from auto manufacturing to agriculture to technology. The largest of these new loads was Big River Steel in Entergy Arkansas territory, a large new Steel facility initiated by US Steel and subsequently acquired by Nippon Steel (see first Clarity Platform view with pricing and Google Earth update image):


In the Consumers Energy territory of Michigan new 115 kv capacity is being constructed to serve the massive Ultium cells Battery facility due to come online in 4th Quarter of 2024 to produce GM EV batteries (see below):

ERCOT
While ERCOT registered the greatest number of new Load Node additions, virtually all were co-located at large new generation (mostly Wind and Solar) facilities. This was also the case for new Storage facilities which continued their strong pace of additions to ERCOT during the Quarter. Shown below (Google Earth) is the substation being constructed for Plus Power’s 200mw/400 mwhr battery project being constructed in South Texas:

Noteworthy Examples of Generation Additions:
NYISO:
While not of the scale of capacity additions in CAISO, ERCOT or PJM, NYISO Solar and Battery additions continued to keep pace in the NYISO ISO Region. See below for Stillwater Solar a 27-mw facility owned by MN8 Energy LLC and operational near Mechanicsville, NY, part of the 67 mw in Solar added to the ISO in the 1st Quarter.

PJM:
PJM saw strong additions of over the 1s Quarter, with 2,474 mws of new generation spread out over twenty-eight new individual projects. Unlike previous periods, these projects were not concentrated in Dominion’s Virgina and N.C. territories; this Quarter shows solar growth further west in Pennsylvania, Ohio, and Indiana. See below for screenshot of Clarity Platform view of Union Solar Farm, a 325-mw facility owned by Acciona Energy USA, and sited in West Mansfield, Ohio:

MISO:
MISO also registered robust growth in Solar capacity additions, just short of PJM at a strong 2,456 mws of new generation. The Quarter saw new Solar projects come online in several Northern States and a few in the Southern States. See below for Clarity and Google Earth views of Elizabeth Solar, a 142-mw facility owned by Horus Louisiana 1 near Grant, LA:


ERCOT:
As can be seen from Chart 4 outlining capacity additions by fuel type, not all new construction was renewable facilities. New natural gas fired power plants were assigned PNodes in NYISO, CAISO and ERCOT over the Quarter. See below for a screenshot of the Remy Jade Gas Power Plant, a 288-mw set of gas turbines owned by WattBridge Energy and located in Fairacres, TX (both Clarity and Google Earth views):


CAISO:
In keeping with the comeback story of natural gas generation, one of the most significant additions of capacity in CAISO EIM territory was the planned conversion of the Intermountain Generating Station, a jointly owned California municipal facility located in Delta, UT. The former 1,800 mw coal fired facility is due to be decommissioned for coal and converted to a 840 mw natural gas fired plant in 2025. See below for current Clarity Platform view:

On the other end of the natural gas spectrum, on the site of GE’s Inland Empire’s 800 mw decommissioned natural gas plant in Rialto, CA, a 100 mw/4-hour Battery project is being undertaken by Strata Clean Energy on the site of the former natural gas generator (Clarity and Google Earth views):


ERCOT INR:
All proposed grid-scale generation or storage projects looking to sell into an ISO market must first apply of Interconnection into the Grid, either at existing points of connection or under terms requiring upgrades or newly constructed infrastructure. These Interconnection (INR) filings are made by the Developer and logged into each of the ISO’s systems for tracking by grid stakeholders.
ERCOT has been the most active ISO in terms of new projects and Clarity has now overlaid new Projects applying for Interconnection onto its GIS mapping of existing resources. As seen below each triangle represents and existing facility (has a PNode) and each green square a proposed project at its proposed location and surrounded by requisite meta-data. This should lend greater context to both the state of the current and future Grid.

If you are interested in viewing all existing and new load and gen facilities, please inquire about a trial at https://www.claritygrid.net and select “Request a Demo.”