0Executive Summary
ISO PNode counts for the 7 US ISOs increased by 99 for Generation and 664 for Load during the last Quarter of 2023. However, modest nodal count additions masked significant increases in Generation and particularly Storage additions onto the US Grid last Quarter. Based upon PNode (Price Node) additions by US ISOs, reported and publicly available mw of capacity, additions to the Generation stack in the US registered an impressive 8,504 mws, and Storage 3.008 mws, a more than doubling of Generation and tripling of Storage additions seen in the 3rd Quarter. Broken out by fuel type, Solar and Wind dominated additions at 6.166 and 2.387 mws, respectively. Viewed by ISO region, MISO saw 29 new Solar projects come online (from a PNode perspective) contributing a staggering 3,082 mws in the Quarter eclipsing the relatively meager additions seen in prior Quarters. MISO also saw 1,156 mws of Wind capacity additions although no new Storage. CAISO and ERCOT also saw significant Solar additions come online at 1,760 and 1,136 mws, with both ISOs also dominating Storage additions at 1,769 and 1,239 mws, respectively. The latest additions bring Clarity’s PNode library count close to 80k, 10,568 for Generation and 68,760 for Load.
Background
While other surveys of US Electric Grid activity publish statistics highlighting additions to grid infrastructure, most notably renewable generation and storage, Clarity Grid focuses intently on key metrics published by the 7 US ISOs, specifically Price Node (PNode) counts. To reiterate from previous Blogs, PNodes are published by the ISOs so that cash can be exchanged (settlements) between market participants and therefore are a necessary precursor to commercial operation of a facility. Once published, a PNode can serve as the “key” to unlock economic information at a given Load or Generation point. Unfortunately, this PNode information is usually cryptic and lacks crucial contextual information, which is where Clarity Grid’s service becomes important. We survey all ISO information daily and update this information on a quarterly basis, although changes can occur in our database at any time should we need to modify the information. In addition to locational information, we enrich our locational data with metadata to provide context to the data and facilitating interconnection. For Load, we capture Utility ownership, interconnecting Transmission Line Capacity (kv) and Anchor Tenants; for Generation, we capture Fuel Type, Ownership, and Mw/Mwhr Capacities. Combined with GIS-based views of all our PNode data via our User Interface, this metadata provides a rich source of grid infrastructure information which is valuable to a wide array of grid stakeholders, including: developers, consultants, researchers, landowners, power traders, and utilities.
Clarity PNode Additions
While PNodes are matched to most Load Nodes (Substations) not all physical Substations are needed for price discovery in the view of ISOs and therefore will not be found in our library, although this represents a small fraction of the Substation universe. As mentioned previously, PNode additions may occur because entire new Utility Systems are added to an ISO, such as in CAISO EIM or SPP WEIS, and existing Substations may also be newly assigned a PNode at the ISO’s discretion. Lastly, PNodes may be added to existing infrastructure locations due to additional capacity (e/g/. transformers) coming online or other considerations for price discovery. We attempt to clearly delineate these additions from the newly constructed Substation infrastructure. While all PNode additions are important, we pay special attention to newly constructed Generation and Load (Substations) as this represents actual changes to Grid infrastructure.
The distinction between newly added and truly new additions can be seen by comparing the 2 Charts below:
Chart 1
4Q 2023 Notional Node Additions
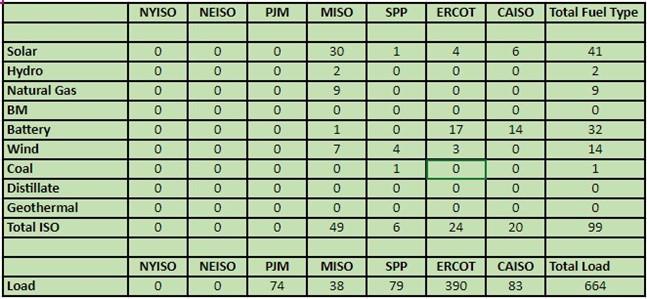
Chart 2
4Q 2023 Newly Constructed Node Additions
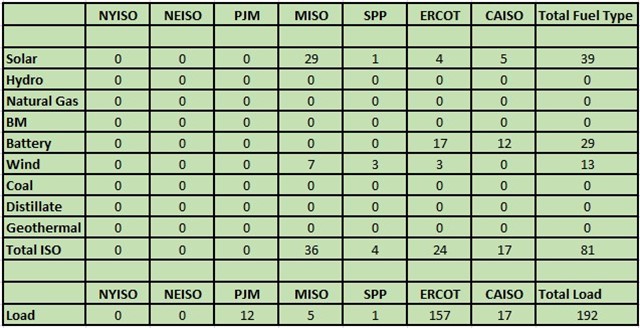
As can be seen from a comparison of the 2 Charts, while notional additions grew by 763 (664 Load and 99 Gen) newly constructed nodal points only registered 273 (192 Load and 81 Gen). This was due to most additions to Load occurring due to the addition of PNodes to preexisting infrastructure in all ISOs, with the exception of NEISO and NYISO which saw no new additions to either Load or Gen nodes.
Newly Constructed Load Nodes
While usually garnering less attention than Generation additions, newly constructed facilities needed to serve new Load is noteworthy as it can be indicative of general load growth on the distribution network, or necessary to serve large new Loads such as distribution warehouse, data centers, or new manufacturing facilities. Most importantly from a developer’s perspective, new Substation construction indicates areas of new capacity for interconnection of distribution resources, particularly battery. Against this metric ERCOT again dominated as it saw 157 of a total of 192 new Load Node additions across the US. It should be noted that new substations are typically constructed in parallel with new Solar, Wind, or in the case of large projects, Storage facilities which ERCOT has typically dominated. Outside of ERCOT, the only noteworthy additions to Load-serving infrastructure was due to 17 PNodes being added in CAISO EIM territory for a single new large manufacturing facility, and 12 PNodes added in PJM collocated with 2 new Solar facilities (one added as Generation last Quarter and one not yet added as a Generation Node), as well as an Amazon Distribution Warehouse.
Newly Constructed Generation (Storage) by Fuel Type
While the pace of new PNode additions over the recent Quarter is in keeping with prior Quarters, there was more than a doubling of both Generation and Storage capacities due to the trend of large new facilities being constructed. We show this in Chart 3 below which highlights additions by both fuel type as well as location (ISO).
Chart 3
Newly Constructed Generation and Storage (mw) 4 Q 2023
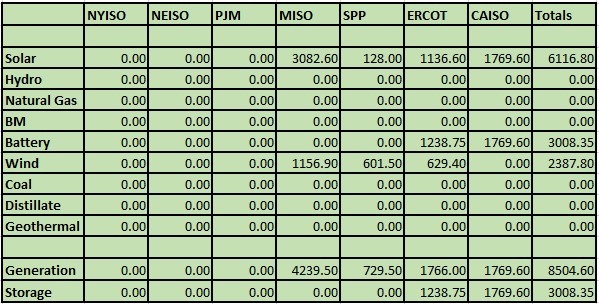
In total 8.5 gigawatts of new Generation and over 3 gigawatts of Storage were added to the Grid over the 4th Quarter by far the largest addition of either since we have been tracking PNode additions. While large projects such as Enel Green Power’s Gulf Star Solar (450 mw) came online in ERCOT, the Quarter was also marked by many new projects– for example, 29 new Solar and 7 large Wind facilities were added in MISO alone. Seventeen new Storage projects were introduced in ERCOT and 12 in CAISO. Unlike previous Quarters, new Battery Projects were not dominated by distribution level (9.95 mw) projects in ERCOT, as 7 projects listed capacities of over 100 mws. Lastly, while NYISO, NEISO, and curiously PJM, saw no newly constructed Generation, SPP did introduce 4 Wind projects each over 100 mws in capacity.
Noteworthy Examples of Load Additions:
PJM
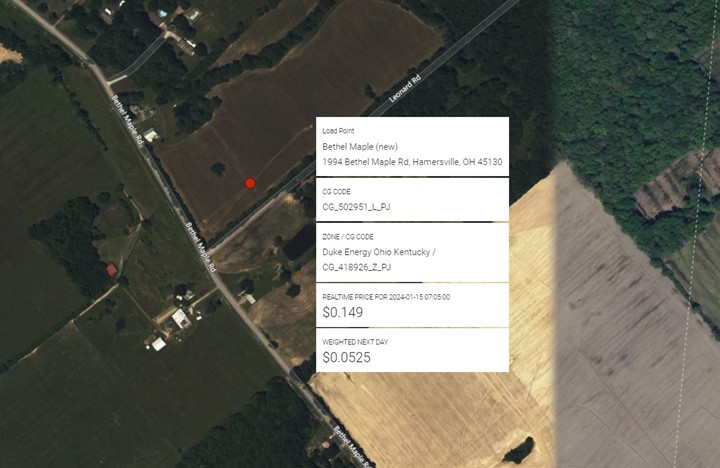
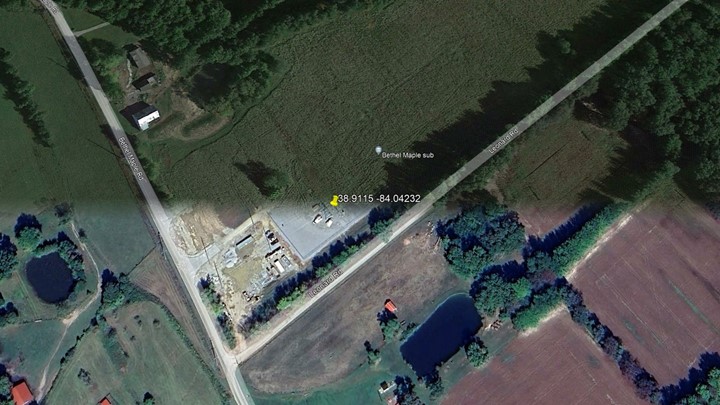
While large new Generation sites command much attention from the market, the addition of Load nodes can be indicative of significant new customer activity within a region or general load growth needing to be served at the distribution level of transmission. While PJM’s greatest share of new load growth has been seen in the Northern Virginia area where data center growth is dominant, it was several new lower capacity substations serving broad population growth which dominated over the recent Quarter. See below for Duke Energy Ohio’s Bethel Maple 34.5 kv connected substation, first with Bing Maps slightly older view, then updated Google Earth satellite image.
MISO
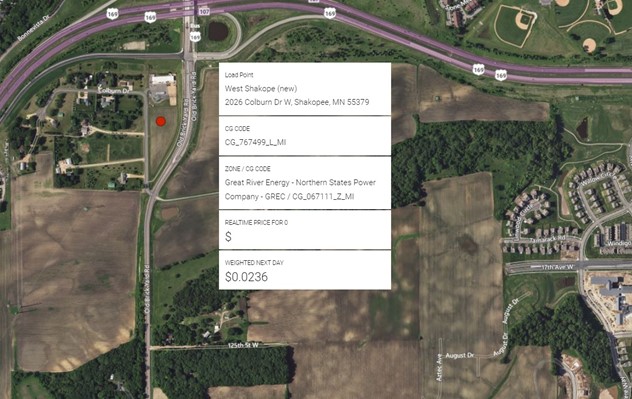
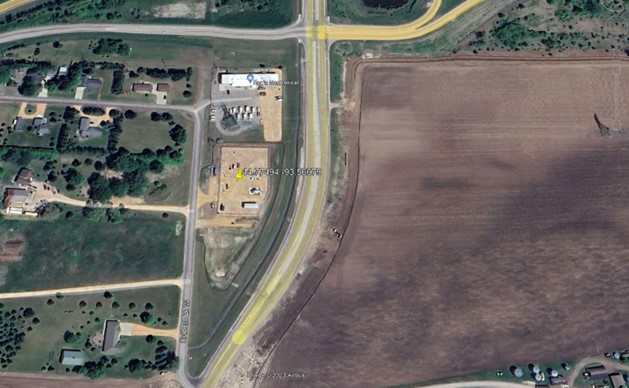
While large Investor-Owned Utilities (IOUs) are the most recognizable energy distributors, the electric distribution network consists of over 2,000 distribution utilities, many of them cooperatives, or municipal, state, or federally owned entities. This patchwork quilt of interconnected utilities is separated into Transmission Utilities (TSPs), or in ISO terms, Load Balancing Authorities (LBAs) which manage large areas of the Grid, and Distribution Utilities (DSPs) which operate within an LBA.. Clarity tracks both and distinguishes these types of utilities in our library. Seen below is a new substation constructed by a municipally owned utility, Shakopee Public Utilities in Minnesota and operating under NSP Minnesota’s (XCELL Energy) transmission authority. Again, both the Bing Maps view from our platform as well as Google Earth’s images are shown below for clarification.
CAISO
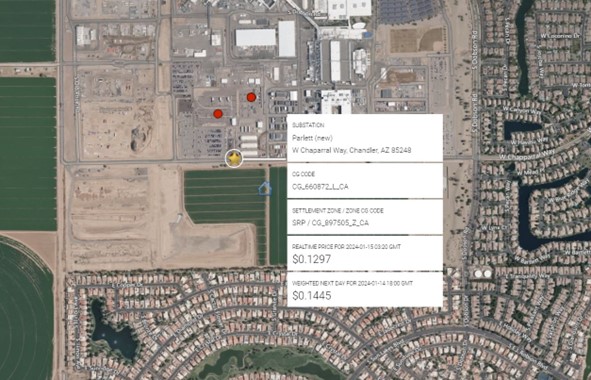
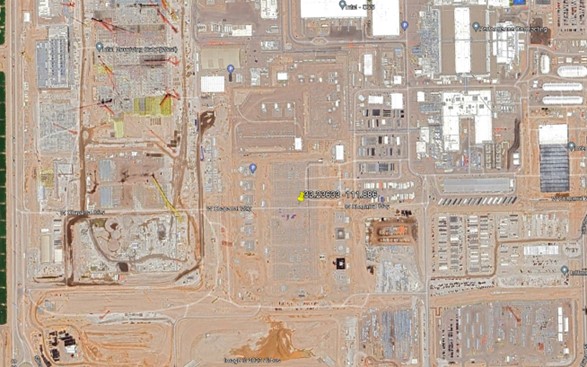
CAISO consists of both the traditional region of the State of California as well as what is known as the “Extended Energy Market” or EIM, which incorporates most of the largest utilities in the Western US. Over the most recent Quarter the only new addition on the Load side was seen in AZ where SRP’s large new 230 kv Parlett Substation was constructed to serve an expansion of Intel’s Ocotillo plant, seen below from out platform as well as Google Earth.
Noteworthy Examples of Generation Additions:
MISO:
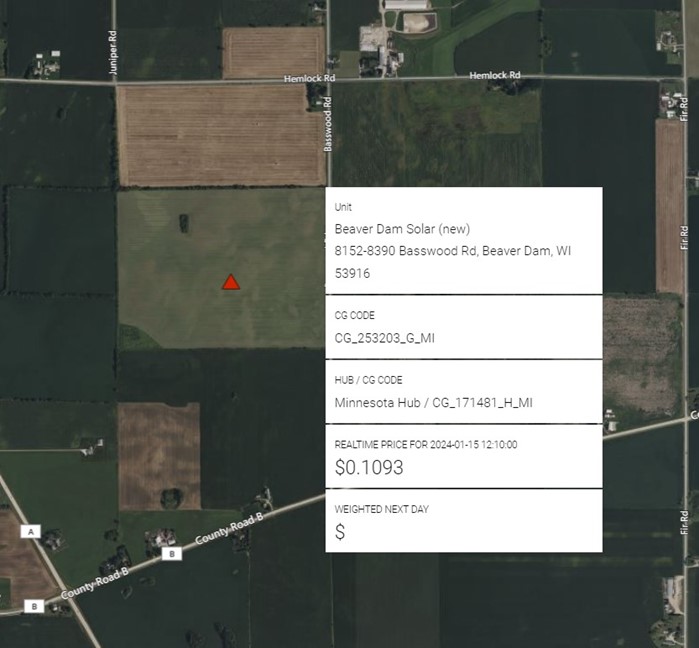
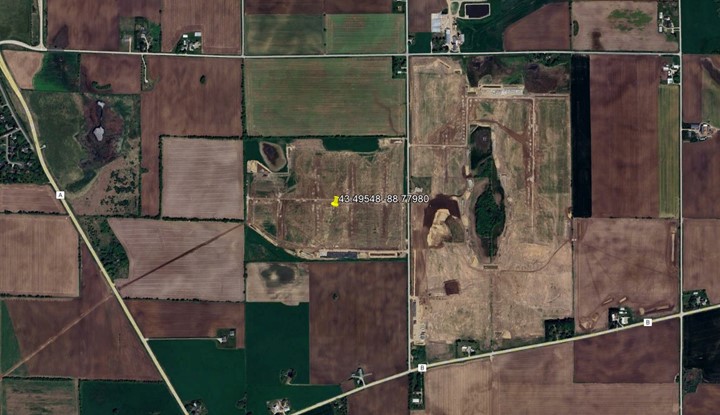
As mentioned, MISO saw 29 new Solar facilities granted Generation PNodes over the quarter, amounting to 3,082 mws of new capacity. These projects ranged in size from 50 to 300 mws and spanned a geographic area from Wisconsin and Michigan in the north, to Louisiana in the south. See below for both Bing (Clarity) as well as Google Earth images of Beaver Dam Solar, a 50 mw Alliant Energy owned project in Wisconsin.
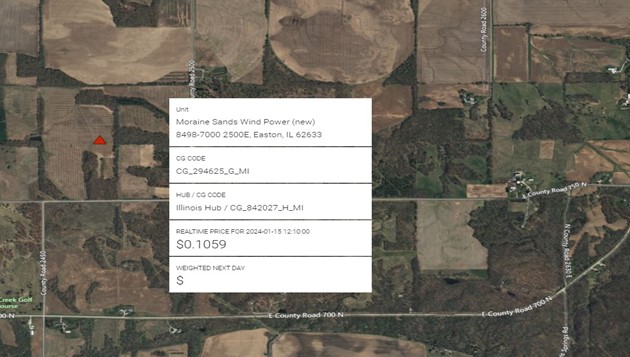
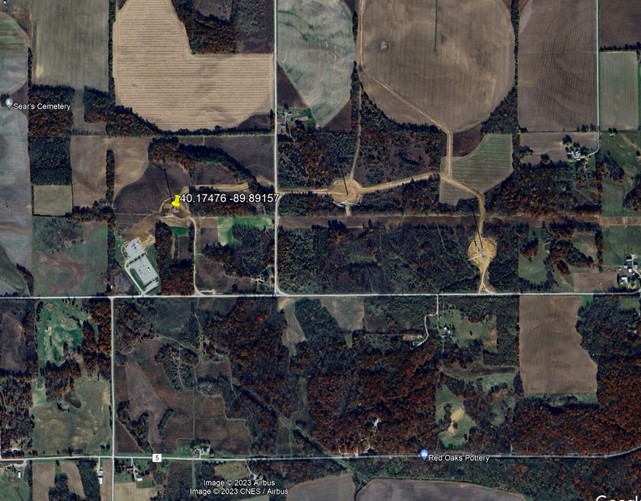
While the pace of solar additions has exceeded large wind projects in recent quarters, wind is still contributing to the build out of a cleaner grid, particularly in the Midwest. Below are screenshots of the Moraine Sands Wind Power project in Ameren’s territory of Easton, IL, a 170 mw jointly owned project of Cordello Power and Swift Current Energy with both the substation and turbines visible in Google Earth image.
SPP:
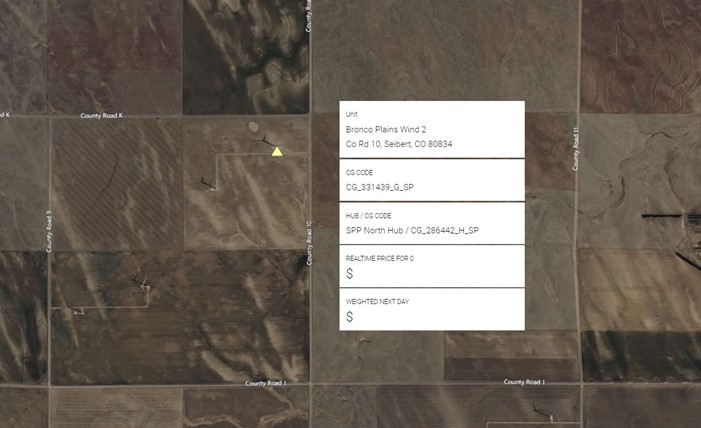
With vast areas of flat land buffeted by strong wind currents, SPP clean Generation has traditionally been dominated by large Wind projects. During the 4th Quarter this was also true as 3 of the 4 new projects identified by PNode were Wind projects, and one Solar farm. In SPP’s version of the Extended Energy Market, or WEIS, Public Service of Colorado’s territory saw NextEra’s 200 mw Bronco Plains Wind 2 introduced last quarter. The image below shows the wind turbines visible.
ERCOT:
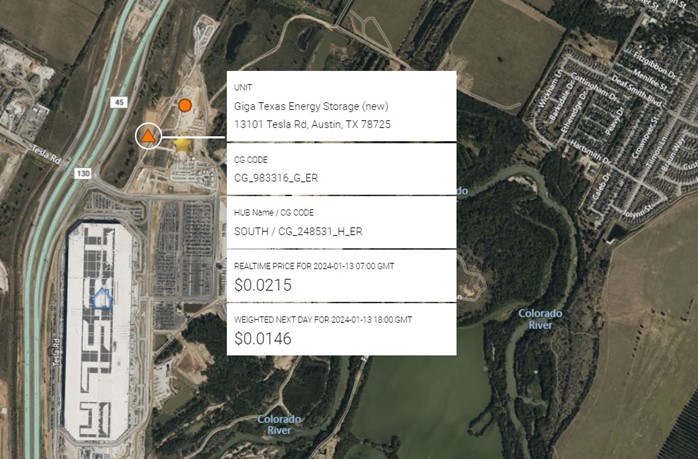
ERCOT continued to dominate the build out of the new electric grid in terms of new battery projects coming online over the Quarter with 17. These projects ranged in size from the expedited distribution level mw capacity of 9.95 to Broadreach Power’s 202.0 mw Libra project in Seguin, TX. Associated with one of the largest new loads in the US, Tesla’s Gigafactory just east of Austin, Tesla is constructing (and been assigned a PNode) for Giga Texas Energy Storage, a 125 mw battery facility sited adjacent to the truck manufacturing facility (shown below as seen from Clarity’s Platform).
CAISO
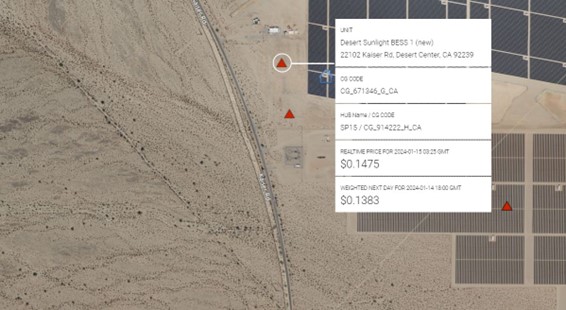
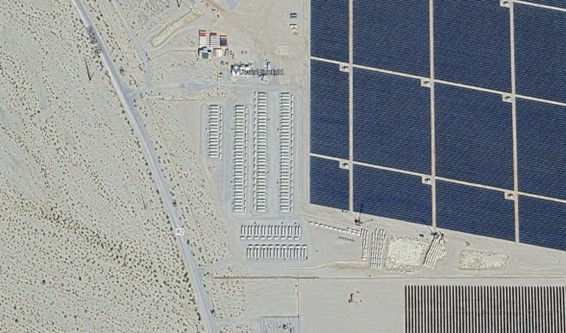
Lastly, CAISO and its associated EIM utilities continue to rapidly build out both Solar and Storage projects, many of which are co-located. Over the 4th Quarter CAISO saw 5 new Solar facilities and 12 new Battery projects granted PNode status. See below images for NextEra’s Desert Sunlight I and II, battery projects of 300 and 230 mws respectively, the battery modules shown clearly in the Google Earth image adjacent to the previously identified First Solar Desert Sun I and II Solar farm, 500 mw.
If you are interested in viewing all existing and new load and gen facilities, please inquire about a trial at https://www.claritygrid.net and select “Request a Demo.”

