Executive Summary
ISO PNode counts for the 7 US ISOs increased by 1,213 over the 3Q 2024;361 Generation and 852 Load nodes., bringing Total Node count in the Clarity library to 81,361. In aggregate, the 7 US ISOs added 3.2 gigawatts of Generation and 1.26 gigawatts of Storage. In keeping with the lumpiness of capacity additions, only ERCOT and CAISO registered additions of Generation and Storage, demonstrating again that Interconnection queues remain stagnant outside of these two regions. There were noteworthy additions to large load serving capacity for data center and chip manufacturing in both the traditional California region as well as Extended Integrated Market of CAISO. Lastly, PNodes associated with Powerex, which transacts in CAISO EIM on behalf of BC Hydro were added to Clarity’s PNode library in keeping with our process of capturing all physical locations of PNodes included in the CAISO Commercial Model. However, price information for these PNodes is not made available by CAISO publicly in keeping with the 2017 CAISO-BC Hydro and Power Authority Agreement of 2017.
https://www.westerneim.com/Documents/Nov3_2017_BC_HydroDataSharingAgreement_ER18-251.pdf
Background
Clarity Grid Solutions has been aggregating Nodal Coordinate data for the 7 US Independent Service Operators (ISOs) since 2016 in support of Grid-based development, power trading, and interconnection support, amongst other grid-stakeholders. Since location is a diver of the value of power, and distributed generation at the Grid level is now more feasible, capturing locational and price data, supported with metadata, is essential to support the development and operations of the current and future Electric Grid.
Nodal locations break down into two primary categories: Load (Substation/Bus) and Generation (Gen) which includes traditional thermal or hydro generators, but also renewable resources such as Wind or Solar. Utility scale Batteries (Storage) are categorized as Generation although they are in fact hybrid resources incorporating both Load and Gen elements. Included in the Nodal output captured from the ISOs are aggregated price indices which fall into the category of sets of Load Nodes in a fixed geographic area (Zones) and Generation Resources (HUBs). Clarity also matches all Nodes (which are locationally specific) to the appropriate Zone or HUB based upon ISO matching to Commercial Model ISOs employ for dispatch modeling.
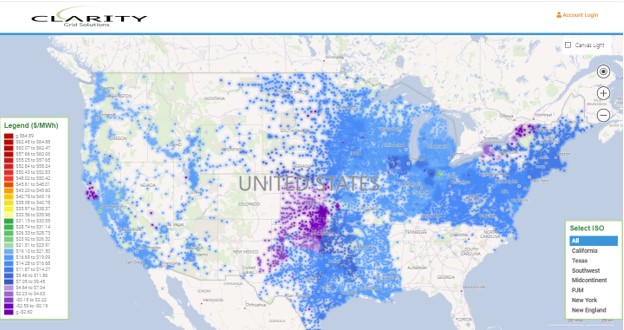
Clarity follows a strict process of seeking first to identify the physical location associated with a given PNode. This process involves significant filtering across all PNodes published by the ISOs as it often is not apparent that a given PNode is even associated with a Load or Gen point. In addition, ISOs publish many PNodes which are not associated with either a physical location nor matched directly to a Zone or HUB based upon ISO Commercial Model relationships. This may include aggregation points for DG (Distributed Generation) or DR (Demand Response) or PNodes which represent points of measurement but not receipt or delivery of energy. This process results in an almost complete visualization of a given segment of the US Grid with embedded price information facilitating interconnection, operation, or transacting across the Grid (see below):
Chart 1
Clarity PNode Additions
Unlike other research sources reviewing changes to the Grid, Clarity focuses exclusively on the addition (or removal) of Price Nodes reported daily by each of the US ISOs. While a new Price Node may not represent a currently active substation, generator, or battery, it is the necessary precursor to its introduction. While all generators/batteries are required to have a PNode assigned, as this is how they are paid through settlement, Load (Substations/Buses) prices may form only one part of a broad Index upon which payment is required and therefore there is not completely covered by the ISOs. Given that PNodes play a critical role in settlement this information validates the tracking of actual grid development. Although not all (Substations/Buses) are assigned a PNode by an ISO, the vast majority (90-95%) are included.
Not all regions of the US are currently covered by ISOs. Notably absent are the Southeastern US and Florida in the East and significant parts of the Western US, formerly known as WECC, in the West. However, ISO coverage has been growing significantly over the last 5 years as both California (CAISO) and SPP have added new Utility systems to their membership, specifically the CAISO EIM and SPP WEIS extended markets. Therefore, Clarity’s PNode counts may change for 4 principal reasons: 1) PNodes may be assigned to previously existing substations, 2) PNodes may be added as a new Utility System is added and its Generation and Load Nodes are incorporated into the ISO, 3) Additional capacity (transformers/generation units) are added to preexisting locations, or 4) Newly constructed Generators or Substations are added to the Grid infrastructure. It is the last category which we focus on most as this represents new additions to the Grid.
The distinction between newly added and truly new additions can be seen by comparing Charts 2 and 3 below:
Chart 2
3Q 2024 Notional Node Additions

Chart 3
3Q 2024 Newly Constructed Node Additions

As can be seen from a comparison of the 2 Charts, while nodal additions grew by 1,176 (815 Load and 361 Gen), newly constructed nodal points only registered 164 (131 Load and 33 Gen). The most significant factor driving these differences was the addition of previously existing BC Hydro grid infrastructure in CAISO, 463 Load and 323 Generation PNodes.
Newly Constructed Load Nodes
In reviewing newly constructed substations over the Quarter there was again very little activity outside of newly constructed load serving capacity in ERCOT and CAISO, which is typically paired with new wind, or more frequently, solar and storage resources. ERCOT and CAISO accounted for all but 10 of the 131 PNode additions associated with newly constructed Substation activity. The increases in CAISO Load PNodes are noteworthy in that they represent new data center and chip manufacturing facilities which is discussed further below.
Newly Constructed Generation (Storage) by Fuel Type
While there are significant lags between proposed new capacity construction and operating status (or even PNode issuance) a review of recent Wind, Solar and Battery additions demonstrates a clear reduction in recent activity. Charts 4-6 show Clarity’s tracking of new Wind, Solar and Battery capacity additions via PNode additions over the most recent 12 months.
Chart 4

Chart 5

Chart 6

As shown in Chart 4. Generation additions over the Quarter were again dominated by Solar, registering 3,025 mws in aggregate. Although this is significantly less than solar capacity additions in prior Quarters, CAISO and ERCOT again dominated these additions with no other ISO Regions recorded ANY capacity additions from a PNode perspective. In the case of Storage, Chart 5, this also was dominated by ERCOT and CAISO which is not surprising in that most new additions were paired with new Solar facilities in both Regions. The addition of Storage, while significant, also lagged additions in prior Quarters. Lastly, additions of new Wind generation, Chart 6, across all ISOs was non-existent over the most recent Quarter.
Chart 7
Newly Constructed Generation and Storage (mw) 3rd Q 2024

Noteworthy Examples of Load Additions:
MISO
While data center growth associated with Hyperscaler demands for new AI computing power has dominated headlines, current PNode additions continue to reveal only additions to traditional data center or distribution center facilities. In the case of MISO, 7 new PNodes, and 3 new Substation locations were added, the most noteworthy being Virlilia: the new Canton, MS Amazon Fulfillment center shown below and connected to Entergy Mississippi’s 230 kv transmission system:

SPP
As mentioned in prior Blog Updates, most of the new additions to PNode counts have been due to the growth in ISO territories in the Western US from either Utility memberships in the “extended” energy markets operated by CAISO (EIM) or SPP (WEIS). One significant addition to WEIS recently is XCEL’s Public Service of Colorado (PSCO) which serves large areas of Colorado including Denver. In addition to merging existing facilities into the power pools, These new also construct new facilities. This was the case over the Quarter with the PSCO Substation, Collins Street which was constructed to serve overall load growth in the Eaton, CO area and is shown below connected to PSCO’s 115kv transmission system.

ERCOT
While much of the Load infrastructure added over recent Quarters is associated with new renewable generation projects, ERCOT in particular, and its major Utilities–Oncor, CenterPoint, TNMP and AEP– have built large substations to serve new manufacturing or energy production facilities. One interesting addition over the Quarter was AEP Texas new 115 kv Chenier Substation in Portland, TX which is associated with Chenier Energy, and constructed to serve the expanded liquification capacity at its Corpus Christ facility.

CAISO
As mentioned earlier, additions of Load or Gen PNodes in CAISO may be due to either California Utilities own construction or the activities of those Utilities making up EIM participation operating outside of the State of California. Over the most recent quarter there was noteworthy new Load Serving capacity constructed for new large loads, all associated with technology companies. In the case of California construction PG&E built three new substation facilities: Bowers Avenue and Memorex Junction tied to new data centers, and San Tomas built to serve new Intel Corporation load in Santa Clara, CA (see both Clarity and Google views below):


In the Extended Integrated Market (EIM) territory, Idaho Power saw a large new Substation facility in Boise ID, the new 230 kv Chip Substation built to serve Micron’s new Fab manufacturing facility (see Clarity and Google views below):


Noteworthy Examples of Generation Additions:
ERCOT:
As mentioned above, ERCOT saw almost 2.5 gigawatts of Solar capacity added over the Quarter, which while significant in absolute terms represents a slowdown compared to previous quarters. This new capacity includes several very large Solar facilities such as Chillingham Solar, and Avantus 360 mw facility, Outpost a 517 mw Hectate Energy project, and Hornet Swisher a 600 mw Solar project constructed by Vesper Energy in Tulia, TX (see both Clarity and Google Earth views below):


On the Storage side, while early ERCOT battery construction was dominated by small (less than 10 mw) projects seeking to connect via ERCOT’s expedited interconnection process, recent storage construction is at a much larger scale. The most recent Quarter saw several projects added which registered over 100 mw of capacity, including the 210 mw Holy EESS facility in CenterPoint’s Crosby, TX territory and constructed by SMT TX (see below):

CAISO:
As mentioned earlier, ERCOT and CAISO were the only ISOs registering ANY additions of Generation or Storage Capacity over the Quarter, and while CAISO did see new additions of 564 Solar mw and 795 Storage mw, these numbers pale in comparison to recent Quarters as show on Charts 5 and 6. In keeping with recent trends of new Solar projects being paired with new Storage, the 70 mw Yuma Solar facility is adjacent to Arizona Public Service Desert Sands Substation and also adjacent to an existing 35 mw Foothills Solar facility. The new Yuma Solar project includes an equivalent 70 mw Storage project Yuma BESS, all three facilities developed by Invenergy Services.

BC Hydro Facilities:
BC Hydro is a large generation and distribution utility operating in the Canadian province of British Columbia Canada. The Utility operates a very large portfolio, (17 gigawatts of hydro generation) covering a vast area of Northwestern Canada. This obviously represents a substantial set of clean generation capacity available for serving the needs of the California and the Western US states.
Powerex is an entity created specifically to market this BC Hydro capacity and was the legal entity which was accepted into CAISO in late 2017. Due to BC Hydro’s legal and regulatory status as Canadian, this made the operation of BC Hydro unique amongst all CAISO EIM member Utilities. As such it was agreed that while BC Hydro PNodes would be populated in the CAISO Commercial Model representing physical Load or Generation assets, neither Locational Marginal Prices (LMPs) nor Congestion prices would be generated for these PNodes– PNodes without the “P”! Instead, a single pricing node virtually situated at the US/Canadian border was designated for import and export settlement. Still in keeping with our protocols in which we identify the physical location for all assets represented by a PNode in the CAISO Commercial Model, we have populated the Node library with this coordinate and metadata.
Below is a screenshot of a high-level view of BCHA nodal locations in Canada by way of example:

BC Load:
Below is a visualization of one of the 463 new Load PNodes assigned to Powerex (BC Hydro) “Home Payne:; in Burnaby, BC.

BC Generation:
As mentioned, BC Hydro operates significant Hydroelectric generating capacity and pictured below is one of 4 Units comprising the Waneta Dam Hydroelectric facility with 490 mw of total nameplate capacity.

If you are interested in viewing all existing and new load and gen facilities, please inquire about a trial at https://www.claritygrid.net and select “Request a Demo.”