Executive Summary
As the calendar turns it is a good time to summarize the progress of each of the ISOs in adding both generation and storage capacities and the role of renewables. Solar dominated additions in 2024 and were much stronger than 2023 in all regions except NEISO and NYISO where only minor additions were recorded. Battery additions were very strong in ERCOT and CAISO dwarfing all other ISOs. While retirements were not tracked via PNodes, gross additions of generation capacity exceeded historic peak load growth in PJM, MISO, CAISO, and ERCOT.
For the 4th Quarter ISO PNode counts for the 7 US ISOs grew by just 838, 636 for Load and 202 for Generation, bringing Total PNode counts in Clarity’s database to 82,199. After accounting for PNodes attached to previously existing infrastructure (Substations, Generation, or Storage) Load Node count additions fell to 257 and Generation and Storage to 175. When viewed as capacity additions in megawatts, Grid additions of 11,461 mws were recorded for Generation and 4,219 mws for Storage. Solar additions once again dominated accounting for virtually all additions, while additions of Battery were strong at 4,220 mws, with CAISO and ERCOT once again dominating all other ISOs.
Background
The lower 48 US States maintain Independent System Operators in 7 different geographic regions (see below):
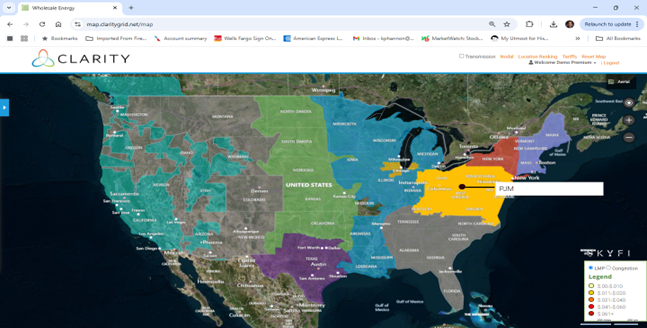
With the recent additions of Public Service of New Mexico, and XCELL Colorado (Public Service of Colorado) most of the Western US is now included in the ISO Coverage areas. This leads most conspicuously to small sections of the Western US and the Southeastern US being dominated by Duke, Southern Company, and FPL Utility — outside of ISO coverage and therefore with limited to no price transparency and other associated benefits. With the exception of these areas, tracking the additions (and deletions) of the coding necessary for settlement of all Generation and Load Serving Activities transactions (PNodes) can yield interesting insights into Grid activity. Essentially, unless Generators or Storage entities are granted a PNode by the ISO they cannot be paid for any of the services ISOs purchase, making the tracking of PNodes as a method marking construction activity on the Grid a valid, although unconventional, method of monitoring.
Review of 2023-2024 Capacity Additions
As can be seen from Chart 1 below all ISOs, apart from NEISO and NYISO, experienced greater capacity additions in 2024 than the previous year, particularly Solar. Solar additions were the most noteworthy trend during 2024 as additions in PJM, MISO, and CAISO roughly doubled 2023 mws, with ERCOT also maintaining a strong pace of construction. Although CAISO did introduce new Wind generation, virtually no other ISO recorded meaningful Wind in sharp contrast to 2023. Battery additions were exceptionally strong in ERCOT and CAISO almost doubling the previous year’s total, while battery additions elsewhere were virtually non-existent. Aggregate capacity additions ranged from virtually 0% in NEISO to a strong 5.21% in ERCOT. Battery additions were strong in ERCOT and CAISO year over year with growth of 2.88% and 3.39% respectively, bringing the total storage capacity in ERCOT to 7,867mw and CAISO’s total storage capacity to 21,726mw.
Chart 1

Clarity 4Q 2024 PNode Additions
Even when distilled into discrete physical points for either generation or load, one must drill down further into the data to see real changes in the Grid. Nodal counts can grow for several reasons other than new construction. Many of the recent additions to Clarity’s nodal counts have been due to entire networks of certain utilities being added to either CAISO’s EIM or SPP’s WEIS markets. These expanded systems aim to reduce overall costs to consumers by optimizing the purchase of power across a larger set of generators within an expanded geographic territory. While these markets can be effective in reducing costs, their share of PNode count additions do not represent new infrastructure, just a re-categorization of existing assets. Likewise, ISOs do not assign PNodes to every substation (as they do with every generator). An ISO may deem only 2 out of 3 nearby substations as necessary to adequately provide price discovery for consumers. They also may later deem the third substation now important enough to assign its own PNode, and the notional count grows.
The distinction between newly added and truly new additions can be seen by comparing the 2 Charts below.
Chart 2
4Q 2024 Notional Node Additions
| NYISO | NEISO | PJM | MISO | SPP | ERCOT | CAISO | Total Fuel Type | |
| Solar | 0 | 0 | 25 | 39 | 1 | 7 | 34 | 106 |
| Hydro | 0 | 0 | 0 | 0 | 1 | 0 | 1 | 2 |
| Natural Gas | 0 | 0 | 5 | 4 | 15 | 0 | 1 | 25 |
| BM | 0 | 1 | 2 | 0 | 0 | 0 | 0 | 3 |
| Battery | 0 | 0 | 2 | 6 | 1 | 26 | 23 | 58 |
| Wind | 0 | 2 | 3 | 2 | 0 | 1 | 0 | 8 |
| Coal | 0 | 0 | 0 | 0 | 0 | 0 | 0 | 0 |
| Distillate | 0 | 0 | 0 | 0 | 0 | 0 | 0 | 0 |
| Geothermal | 0 | 0 | 0 | 0 | 0 | 0 | 0 | 0 |
| Total ISO | 0 | 3 | 37 | 51 | 18 | 34 | 59 | 202 |
| NYISO | NEISO | PJM | MISO | SPP | ERCOT | CAISO | Total Load | |
| Load | 0 | 2 | 99 | 16 | 43 | 449 | 27 | 636 |
Chart 3
4Q 2024 Newly Constructed Node Additions
| NYISO | NEISO | PJM | MISO | SPP | ERCOT | CAISO | Total Fuel Type | |
| Solar | 0 | 0 | 22 | 39 | 1 | 7 | 34 | 103 |
| Hydro | 0 | 0 | 0 | 0 | 0 | 0 | 0 | 0 |
| Natural Gas | 0 | 0 | 3 | 0 | 6 | 0 | 0 | 9 |
| BM | 0 | 0 | 0 | 0 | 0 | 0 | 0 | 0 |
| Battery | 0 | 0 | 2 | 6 | 0 | 26 | 23 | 57 |
| Wind | 0 | 1 | 2 | 2 | 0 | 1 | 0 | 6 |
| Coal | 0 | 0 | 0 | 0 | 0 | 0 | 0 | 0 |
| Distillate | 0 | 0 | 0 | 0 | 0 | 0 | 0 | 0 |
| Geothermal | 0 | 0 | 0 | 0 | 0 | 0 | 0 | 0 |
| Total ISO | 0 | 1 | 29 | 47 | 7 | 34 | 57 | 175 |
| NYISO | NEISO | PJM | MISO | SPP | ERCOT | CAISO | Total Load | |
| Load | 0 | 0 | 23 | 8 | 12 | 201 | 13 | 257 |
As can be seen from a comparison of the two Charts, while notional additions grew by 838 (636 Load and 202 Gen) newly constructed nodal points only registered 432 (257 Load and 175 Gen). This was due to large additions to existing substations load serving capacity in ERCOT (449 vs 201) as well as most additions in PJM, MISO, SPP and CAISO tied to pre-existing load serving infrastructure. PNodes assigned to generation were mostly due to new construction as can be seen by comparison of the Chart totals.
Newly Constructed Generation (Storage) by Fuel Type
Examining now actual net additions of generation to the 7 US ISOs in megawatts (mw) rather than nodal additions and separating them by fuel type gives a fuller picture of growth of renewables, storage, and other forms of generation over 4th Quarter of 2024.
Chart 4
4Q 2024 Newly Constructed Node Additions (mw)
| NYISO | NEISO | PJM | MISO | SPP | ERCOT | CAISO | Totals | |
| Solar | 0.00 | 0.00 | 1,519.20 | 4,979.00 | 140.00 | 1,081.05 | 1,629.50 | 9,348.75 |
| Hydro | 0.00 | 0.00 | 0.00 | 0.00 | 1.00 | 0.00 | 8.00 | 9.00 |
| Natural Gas | 0.00 | 0.00 | 0.00 | 356.00 | 196.50 | 0.00 | 0.00 | 552.50 |
| BM | 0.00 | 8.00 | 129.40 | 0.00 | 0.00 | 0.00 | 0.00 | 137.40 |
| Battery | 0.00 | 0.00 | 40.00 | 417.00 | 35.40 | 1,511.21 | 2,251.50 | 4,255.11 |
| Wind | 0.00 | 29.10 | 689.00 | 500.00 | 0.00 | 150.00 | 0.00 | 1,368.10 |
| Coal | 0.00 | 0.00 | 0.00 | 0.00 | 0.00 | 0.00 | 0.00 | 0.00 |
| Distillate | 0.00 | 0.00 | 0.00 | 0.00 | 0.00 | 0.00 | 0.00 | 0.00 |
| Geothermal | 0.00 | 0.00 | 0.00 | 0.00 | 0.00 | 0.00 | 0.00 | 0.00 |
| Generation | 0.00 | 37.10 | 2,337.60 | 5,835.00 | 337.50 | 1,231.05 | 1,637.50 | 11,415.75 |
| Storage | 0.00 | 0.00 | 40.00 | 417.00 | 35.40 |
1,511.21 |
2,251.50 | 4,255.11 |
Solar once again dominated the category of new generation adding over 9,000 mws during the Quarter while Battery additions kept up the strong pace established this year with the addition of over 2,000 mw of storage in CAISO particularly noteworthy. While there were additions to Wind generation, unlike 3Q 2024, they barely exceed 1,000 mws clearly indicating this category has lost momentum recently. Lastly, the fact that there were additions at all to natural gas generation was noteworthy although this is a category which is certain to make a strong comeback in future quarters.
Noteworthy Examples of Generation Additions:
PJM
After registering no new solar generation additions last Quarter, PJM saw over 1,500 mws added to the Grid bringing total additions for the year to 5.429 mws. The Dominion territories in Virginia, and to some extent North Carolina, has been one of the most active.
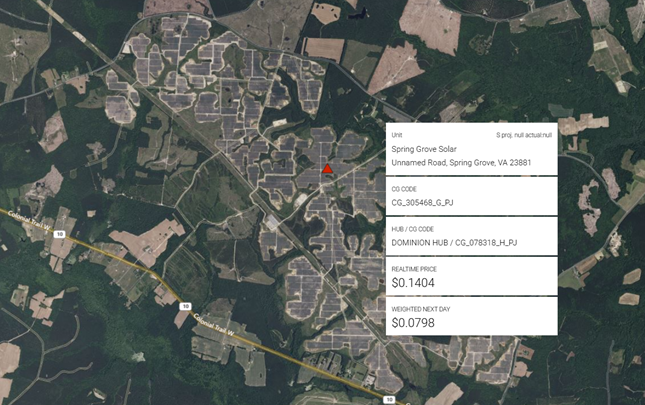
This is due in part to large data center growth in the eastern part of the state matched with the carbon reduction mandates of its hyper-scaler owners. These mandates are generally considered to be satisfied by commensurate solar (or wind) developments and their PPA offtake agreements even if constructed in the western or southern part of the state and dispatched into the PJM Dominion Zone. One example of this is the 98 mw Spring Grove Solar facility constructed by Dominion Energy and awarded a PNode this past quarter.
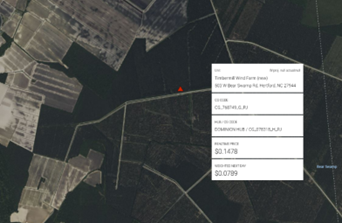
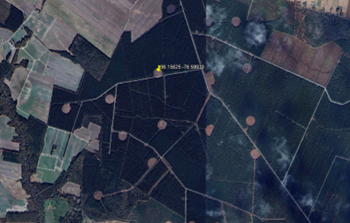
While wind generation facilities seem to have peaked additions to the grid stack, there were two new significant wind facilities added in PJM during the quarter, the 200 mw Top Hat Wind Farm in Commonwealth Edison’s Illinois territory built by Invenergy, and the
189 mw Apex Clean Energy Wind farm coming online in Herford, NC and seen below (both Clarity and Google Earth views):
MISO
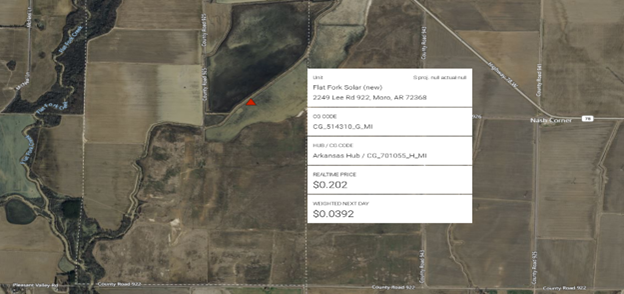
After recording only minor additions of generation in the form of exclusively solar in the previous quarters of the year, the floodgates opened in MISO in the Fourth Quarter as almost 5,000 mws of solar generation were recorded over 39 projects. Grid additions were seen stretching in the North from Minnesota to the South in Louisiana across MISO’s expansive territory. This is also noteworthy in that MISO has relied upon thermal and to some extent wind generation to a much greater extent than the Northeastern Utilities or ERCOT or CAISO with little previous solar development. Over the year we tracked a total of 8,314 mws of solar additions which accounted for virtually all net additions of generation to its grid stack. One of the largest new solar farms coming online was NextEra’s 200 mw Flat Fork Solar facility in Moro, AR.
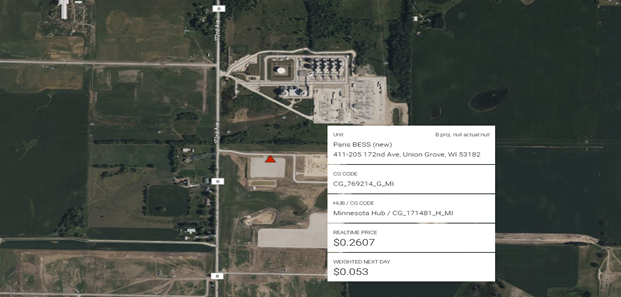
While different from the stand-alone merchant variety in ERCOT or paired with large solar configurations of CAISO, MISO has started to register noteworthy new storage projects. Over the most recent Quarter MISO saw 419 mws of Storage become operational from 6 projects. The 100 mw Paris BESS constructed by Invenergy in Union Grove, WI is shown below:
ERCOT
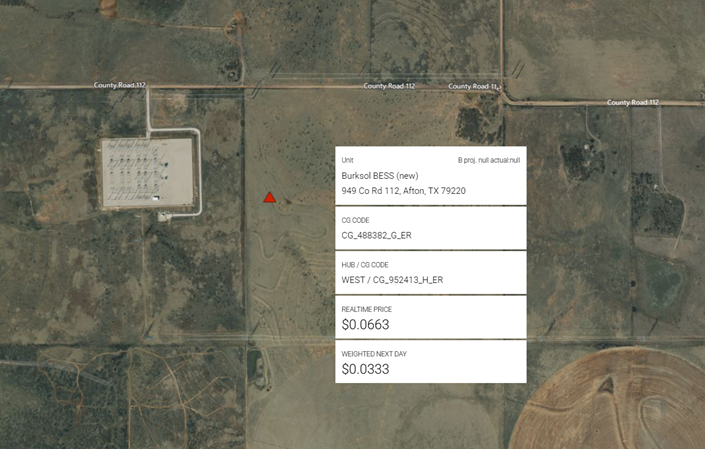
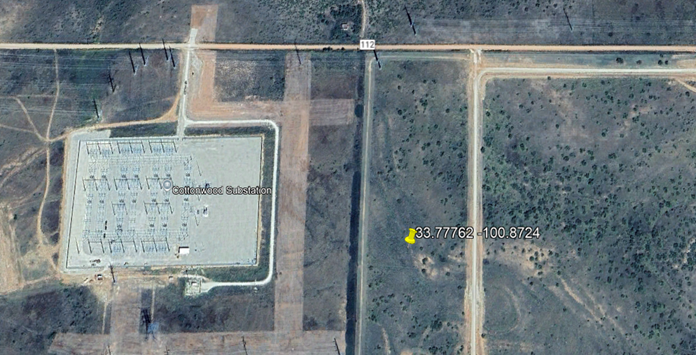
For the first time observed over the life of grid scale battery construction, Storage led all forms of Resource additions to ERCOT’s Grid over the 4th Quarter. Storage registered gains of over 1,500 mws bringing yearly gains to 3,822 mws despite poor economics over the 2024 summer which has continued into the New Year. Storage gains exceed Solar for the first time which registered 1,081 mws bringing yearly additions to 6.084 mws. Wind generation which had been the driving force for renewable generation growth in ERCOT over previous years were only 105 mws in the 4th Quarter and totaled 513 mws for the Year. Equally impressive on the Battery side was the breadth of new additions as 26 new facilities came online over the Quarter dominated by 9.9 mw mostly 2-hour duration configurations. Amongst the largest outliers was volta’s 103 mw/206 mwhr Burksol BESS facility (one of 2 projects the company brought online) and seen below (both Clarity and Google Earth views):
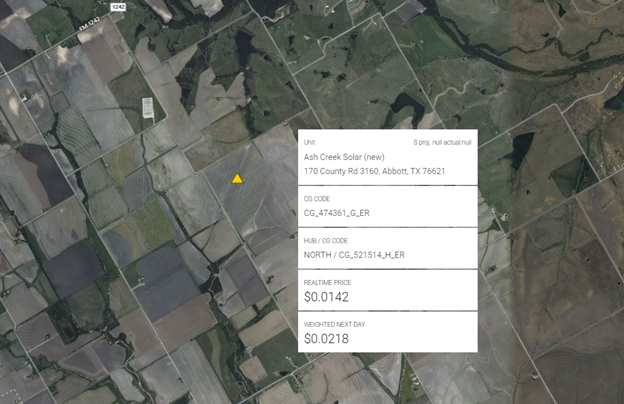
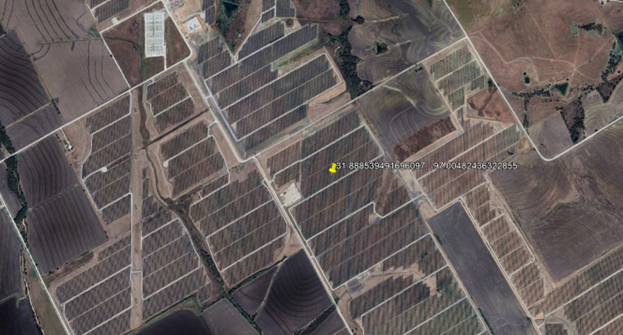
Despite lagging Storage, Solar additions were marked by one very large new facility which is noteworthy. Seen below is Primergy’s 409 mw Ash Creek Solar farm in Abbott, TX just north of Waco in Oncor territory:
CAISO
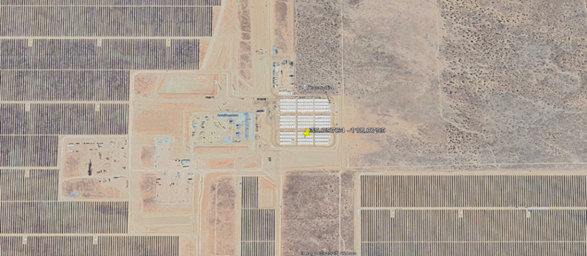
Like ERCOT, CAISO saw Storage additions over the most recent Quarter dominate the only other category registering gains, Solar, 2,252 to 1,630 mws. Battery additions were also well disbursed both geographically and across projects with 23 individual projects coming online. However, despite this breadth growth was largely contributed by a few very large projects, most notably by three separate Avantus BESS projects, Bellefield Solar BESS 1, 2, and 3. Seen below is a screenshot of Bellefield BESS I a 100 mw/400 mwhr Project which came online in the Mojave Desert in the Quarter:

Noteworthy Examples of Load Additions:
As mentioned earlier Load PNodes may be added to the set of ISO Nodes for several reasons. Previously existing infrastructure (Substations) may subsequently be assigned a PNode to provide for greater price transparency when ISO conduct their SCED (Security Constrained Economic Dispatch) during which PNodes are assigned LMPs (Locational Marginal Prices). Also, since the relationship between PNodes and physical Substations can often be many to one, new PNodes are added to previously exiting Substations due to additions of new hardware (transformers) to existing substations. This can also occur for generation PNodes when plants undergo expansion. By far the largest additions to the PNode library occur when ISOs add Utility membership for systems which heretofore operating outside of an ISO as seen recently in CAISO EIM and SPP WEIS. It should be noted however that these expansions have been limited to the joint dispatch of generation and storage assets into the Real Time market which clears every 5 minutes and not in the hourly Day Ahead market, although CAISO has announced plans to initiate this in 2026 https://stakeholdercenter.caiso.com/StakeholderInitiatives/Extended-day-ahead-market.
After filtering for these characteristics, Clarity identifies those PNodes which match to newly constructed infrastructure to track true additions to load serving infrastructure. For the most recent Quarter we tracked 257 new PNodes vs 636 Notional additions. The largest increase was still in ERCOT which recorded 201 new PNodes for Load. Unlike CAISO which has rapidly grown its generation and load serving infrastructure, ERCOT’s convention is to assign new PNodes for Load to newly constructed Solar and Battery facilities and in many cases several PNodes to one new facility. The other ISOs saw small additions of PNodes assigned to Load some of which is described below.
PJM
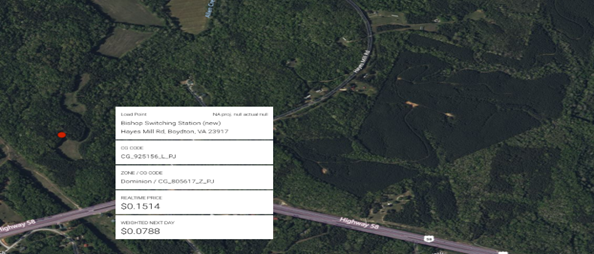
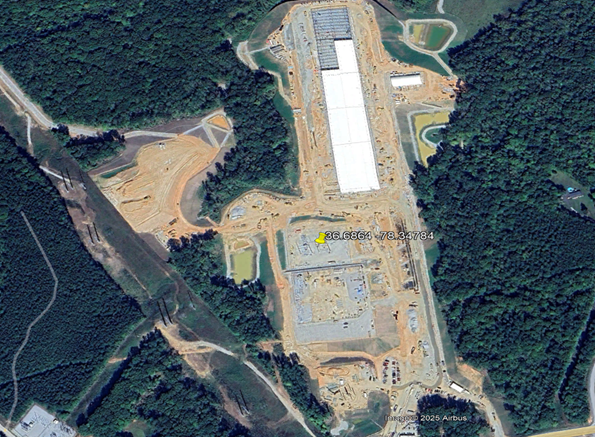
Headlines announcing plans by hyperscalers to dramatically increase power consumption needs due to new Data Center construction tied to AI have shaken the industry. PJM is of course home to an estimated 50% of all existing data centers, heavily concentrate in Dominion Energy’s Northern Virginia territory. Therefore, we are focused on tracking PNode activity tied to new data centers and will be introducing a data layer adding to existing metadata we track on our Platform for all US ISOs. One such example is shown below in Boydton, VA where Dominion is constructing the Bishop Switching Station a 115 kv Substation serving a new Data Center (both Clarity and Google Earth views).
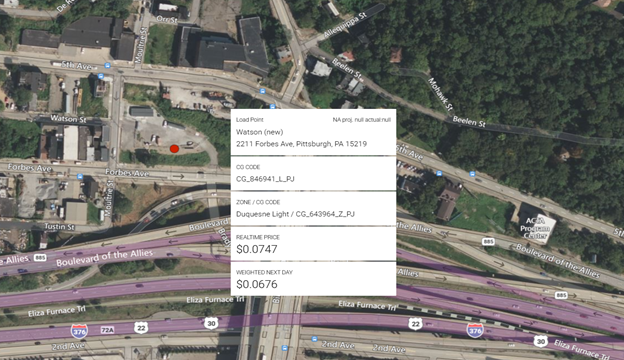
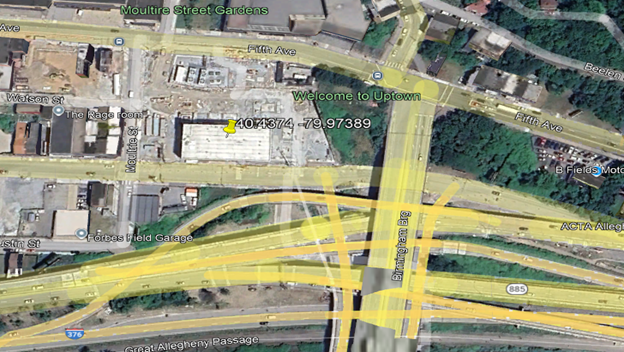
In Duquesne’s Pittsburgh PA territory new substation construction was completed to serve its namesake University, Duquesne Substation at 138 kv voltage (both Clarity and Google Earth views).
MISO
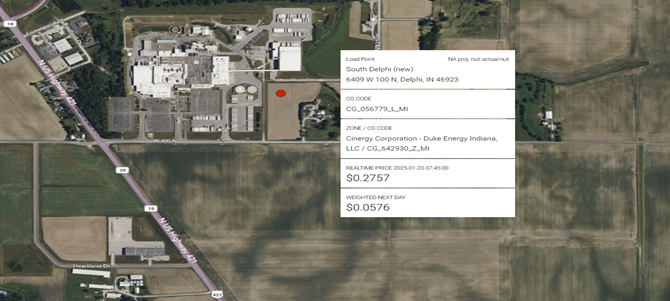
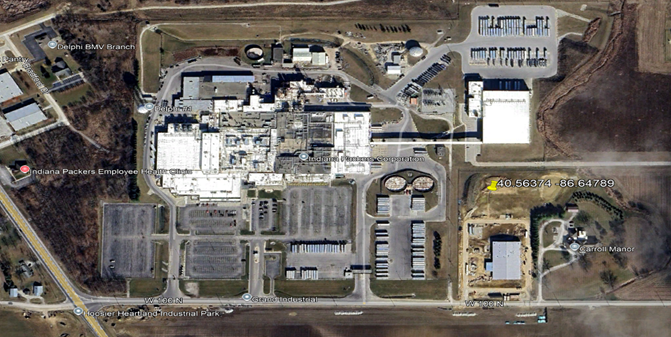
Unlike PJM, MISO has traditionally built new substations to serve more traditional manufacturing load which dominates it large North to South territory running along the Mississippi river. A noteworthy example of this is Duke Indiana’s new 115 kv South Delphi substation built to serve an expansion of the Indiana Packers plant in Delphi, IN (both Clarity and Google Earth views):
CAISO
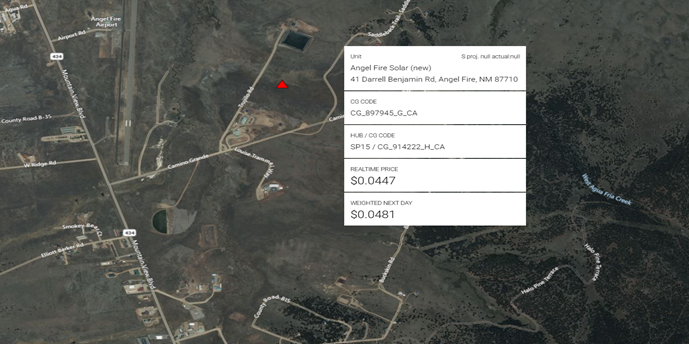
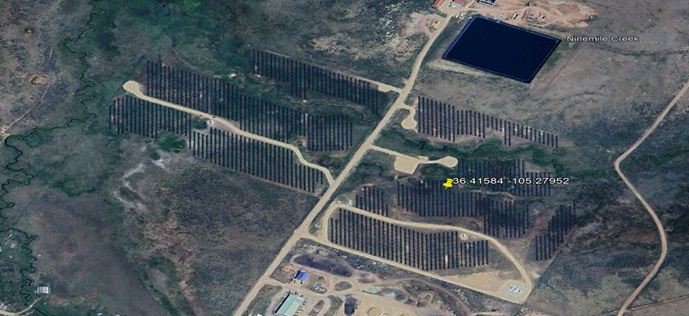
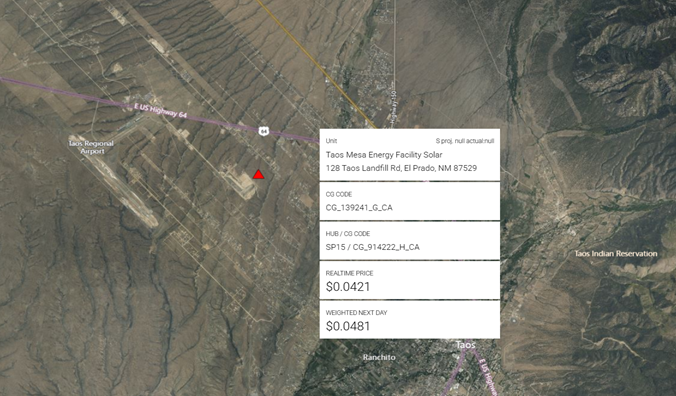
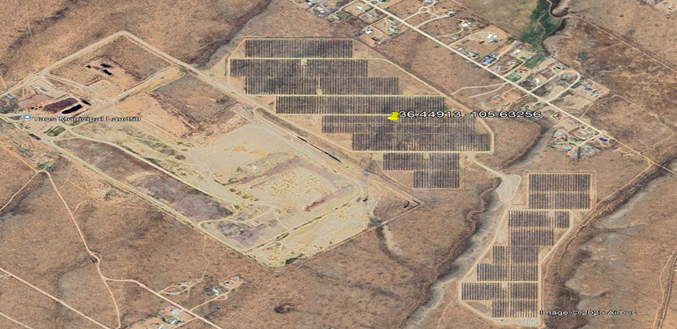
Apart from one BPA Substation in Washington State, all new CAISO Load activity occurred in New Mexico, by the EIM Utility PNM. These 115 kv substations were tied to new Generation construction activity, specifically the Angel Fire Solar and Taos Mesa facilities respectively and each shown below (both Clarity and Google Earth views):
ERCOT
Not to be outdone by CAISO, ERCOT has also seen large data center construction recently although predominantly tied to Crypto mining facilities. This activity is shifting to more traditional and even higher capacity AI computing facilities most noteworthy Oracle’s new Abeline data center https://www.datacenterdynamics.com/en/news/oracle-hiring-for-abilene-texas-stargate-data-center-roles/ and the first of the publicly announced Stargate $500 billion publicly supported by the new Administration. Given the large energy demands it is not clear what role the existing or future Grid will play as much of the discussion has been on constructing new behind the meter generation.
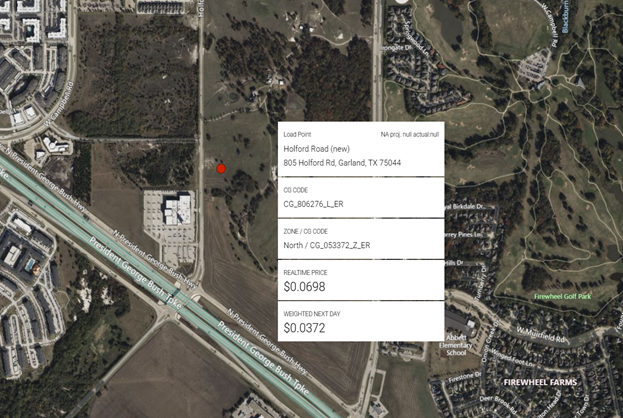
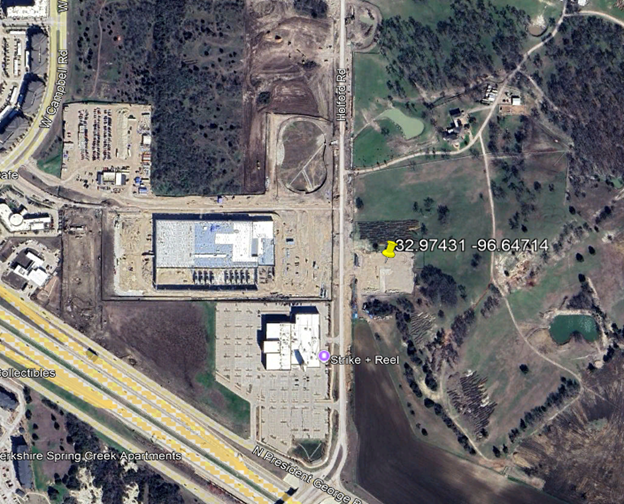
Of the more traditional flavor of load serving infrastructure is the Holford Road Substation, a 138 kv substation owned by the City of Garland, TX and built to serve new Prime Data Center facilities (Clarity and Google Earth views):
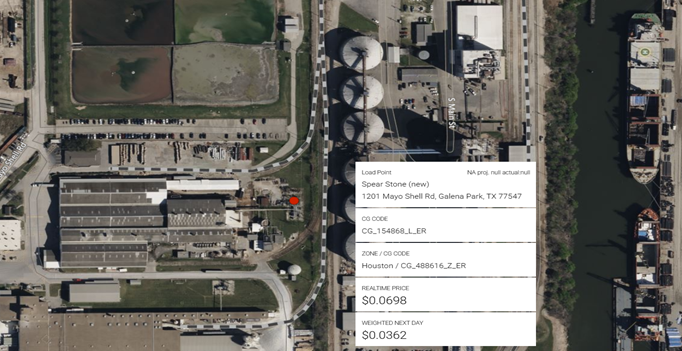
Lastly, in the mode of more traditional large power consumers, Centrepoint has brought online the new 138 kv Spear Stone Substation to serve a United States Gypsum Plant being constructed just east of Houston, TX in the Galena Park area:
If you are interested in viewing all existing and new load and gen facilities, please inquire about a trial at https://www.claritygrid.net and select “Request a Demo.”

