Executive Summary
ISO PNode counts for the 7 US ISOs increased modestly by 761 over the 2Q 2024, with 122 Generation and 639 Load nodes. In aggregate, the 7 US ISOs added almost 11 gigawatts of Generation and Storage, comprised of 7.702GW Gen and 3.285GW Storage. Not surprisingly, ERCOT and CAISO led all ISOs in both Node counts and Capacity additions although additions to both PJM and MISO, principally driven by Solar installations, were not insignificant. ERCOT dominated load additions with almost 100 new PNodes, often paired with new generation or storage but also specifically constructed to serve new bitcoin mining facilities. Lastly, with interconnection activity (INR Reporting) now added to the Platform we are tracking the progress of new projects from Application to Grid Operating status in ERCOT over the recent Quarter. We provide three Charts in the final section which display some surprising results for Solar, Wind and Battery development since 2020.
Background
Clarity Grid Solutions has been aggregating Nodal Coordinate data for the 7 US Independent Service Operators (ISOs) since 2016 in support of Grid-based development, power trading, and interconnection support, amongst other grid-stakeholders. The Library of PNodes matched to coordinate locations with accompanying metadata allows Users of our Platform to match location with the economics of generation, storage or consumption. By strictly following PNode additions and adding metadata such as location, Transmission Utility (TSP) or Distribution Utility (DSP), interconnecting transmission/distribution line capacity (kv), generation fuel, and anchor loads, a clearer picture emerges of the Current State of the Grid, than can be provided by studies or commentary focused on one aspect of infrastructure or pricing.
Like much of the data produced by the 7 US ISOs, raw PNode data is not particularly useful to most industry participants. Many PNodes represent specific substations or generation units which can be mapped to physical locations. However, PNodes can also be used for settlement for Load (or in some cases Generation) for a broad set of physical points, as energy measurement (but not settlement) points or various other reasons, and therefore are not appropriate for identification of potential points of interconnection for generation or storage. Examples of these types of PNodes includes traditional Load Zones, or HUBs, but also increasingly PNodes established to provide settlement prices for all Distributed Energy Resources or Demand Response assets within a given region.
When reviewing PNode additions we make a distinction between gross additions, which include PNodes representing additional generating units or transformers for load serving, from PNodes matched to newly constructed generation or load infrastructure. Also excluded from newly added PNodes are pre-existing substations which have PNodes assigned to them by the ISO for the first time. Lastly, pre-existing infrastructure for entire Utility systems who may join an ISO for the first time are also not counted as new, as seen recently in CAISO’s EIM and SPP WIES programs.
Aggregate PNODE Additions by Fuel Type/Load
Chart 1

Chart 1 shows gross additions of 639 Load and 122 Generation PNodes. ERCOT again dominated Load additions with 259 while CAISO and PJM recorded approximately 150 Load nodes each. For Generation by ISO CAISO added 73 new nodes, PJM 27 and ERCOT 11. As discussed previously, many PNodes may be matched with a single physical substation, although typically matches are one to one and each ISO has its own assignment protocols. In addition, the large numbers of new substations in ERCOT and CAISO can be partly explained by interconnection protocols. While ERCOT and CAISO usually pair new renewable generation facilities with a new substation and PNodes representing Load, PJM typically interconnects to an existing substation creating no new PNode. In addition, the virtual absence of new Storage resources in areas other than ERCOT and CAISO, which often requires a new Substation to serve it, also explains the lag in Load Node additions outside of these two areas.
Aggregate Capacity Additions (MWs)
Chart 2

Chart 2 shows gross additions of megawatt capacity for both Generation and Storage over the 2nd Quarter. CAISO (which includes the Western Utilities outside of California in the EIM markets) dominated both generation and storage capacity additions as it has for several quarters. Most surprising are strong additions of Solar capacity in the PJM Region, which exceeded totals for ERCOT and MISO. Overall, the addition of almost 6.3 gws of Solar dominated all other fuel types, in particular new Wind facilities which have trailed off recently. On the storage side, while it was not surprising to see strong additions to CAISO, ERCOT storage capacity additions lagged previous periods growth with some indications the market was approaching saturation. Nevertheless, both ISOs additions in storage were in sharp contrast to the remaining ISOs which recorded NO new projects based upon PNode counts. Noteworthy amongst additions was 678 mws of new gas fired generation for three new facilities listed in CAISO but sited in the CAISO EIM areas of WY, NV, and AZ. Lastly, while new Wind facilities have played a significant role in renewable generation additions recent Quarters, they have trailed off significantly save for minor additions in CAISO and a small project in MISO.
Newly Constructed PNodes
Chart 3

Newly Constructed Capacity (MWs)
Chart 4

Newly Constructed Load Nodes
PNodes added over the Quarter for newly constructed Load and Generation,(Chart 3) show striking differences., While Generation numbers were roughly equivalent, Load PNodes were substantially less than nominal additions. This was due to both the matching of previously existing substations to a PNode (PJM) as well as additions to Load serving capacity at previously existing Generation or Storage sites (CAISO/ERCOT). In addition, while a majority of PNodes are matched to a location each Quarter, the small fraction which remain are often matched at a later date as more information becomes available. These PNodes are not considered “Newly Constructed” and account for some of the difference between the two categories.
Newly Constructed Generation (Storage) by Fuel Type
Unlike PNode additions, which may occur for several reasons other than new construction, Gross additions of Generation Capacity (MWs) usually are the same as Newly Constructed additions. Historically the only substantive reason for discrepancies is usually due to new Utility Systems being integrated into and Extended Energy Market such as CAISO EIM or SPP WEIS, as discussed. We have seen such integrations over the past several quarters. While no new Utilities are slated to expand the CAISO EIM footprint, SPP’s WEIS does anticipate the additions of seven new Utilities by 2026 https://www.tdworld.com/overhead-transmission/article/21273729/spp-rto-will-expand-with-commitments-from-western-utilities. Over the recent Quarter the totals for both Nominal and Newly Constructed Generation would be identical save for a small preexisting Hydro facility added in PJM.
Noteworthy Examples of Load Additions:
PJM
After decades of historic load growth of less than 1% Utility planners have been busy dramatically revising both Average and Peak load growth assumptions upwards as the reality of continued demand growth for cloud computing, EV charging, green hydrogen, bitcoin mining, and lastly the energy demands of AI compute capacity have created a “perfect storm” of expectations for future demands on the electric grid. Nowhere is the phenomenon more apparent than in PJM’s Dominion territory of Northern Virginia where peak demand growth forecasts now approach 5% annually which would create a doubling of overall demand in 15 years https://www.pjm.com/-/media/library/reports-notices/load-forecast/2024-load-report.ashx. However as a reminder, while forecasts are significant we follow a strict methodology of verifying new sources of both Generation and Load based solely upon the ISO-certified issuance of PNodes which are required for the settlement of both Load and Generation either directly or indirectly.
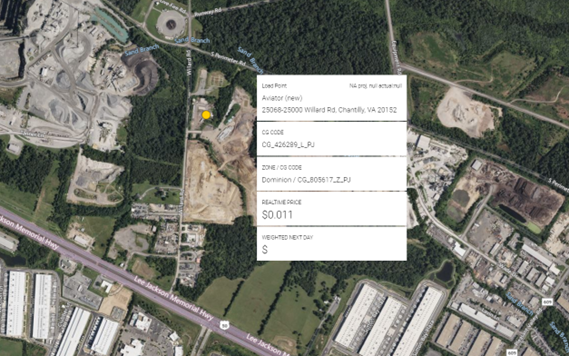
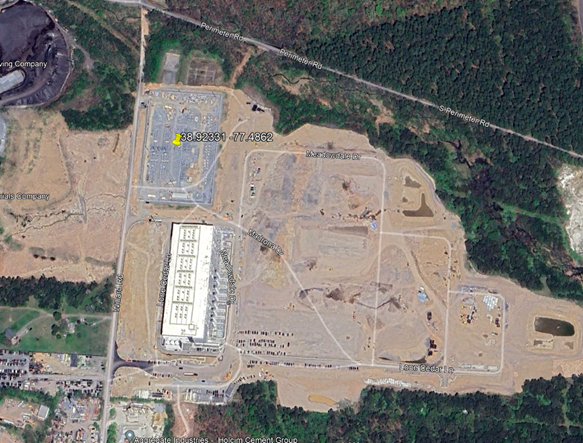
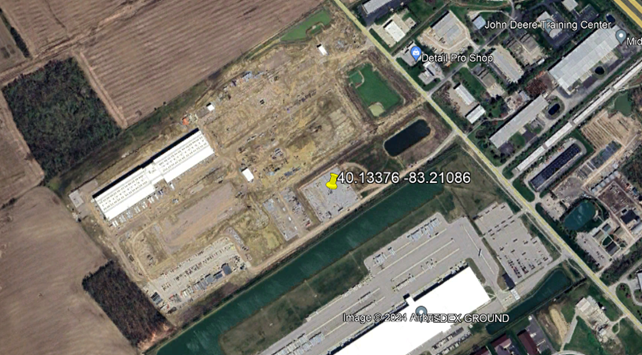
Over the quarter there were 9 individual sets of PNodes introduced to settle Load and 2 for new data centers, both built to service Amazon. The first is the Aviator substation connected to Dominion Energy’s 138 kv transmission system near Dulles Airport (both Clarity Grid and Google Earth views shown below):
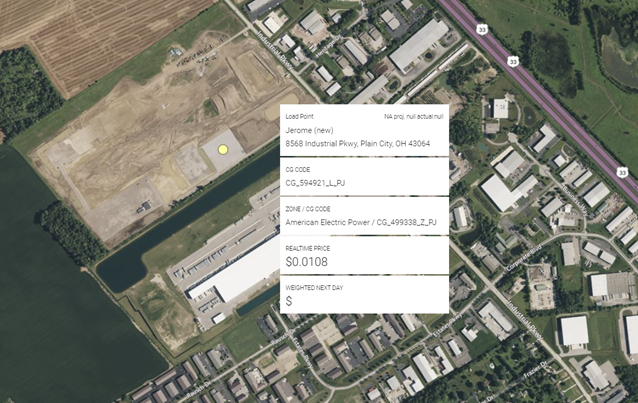
The second is the Jerome susbstation connected to AEP Ohio’s 138 kv system (both Clarity Grid and Google Earth images shown below):
MISO
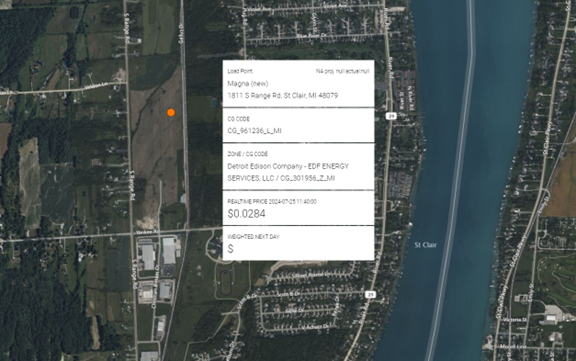
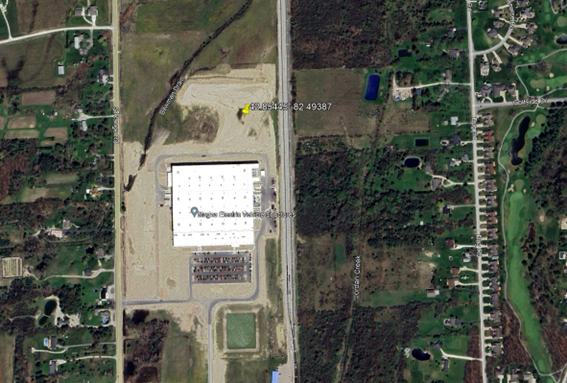
While data center and overall load growth (particularly in MISO South) have been part of the equation in MISO lately, MISO remains a heavy manufacturing region (particularly in MISO North) traditionally dominated by the auto industry. This trend continued over the Quarter with Detroit Edison’s new Magna Substation constructed to serve the Canadian auto components company and connected to DTE’s 120 kv system in St Clair MI (see both Clarity Grid and Google Earth images below):
ERCOT
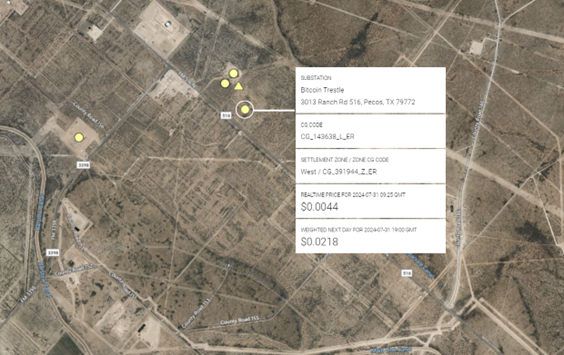
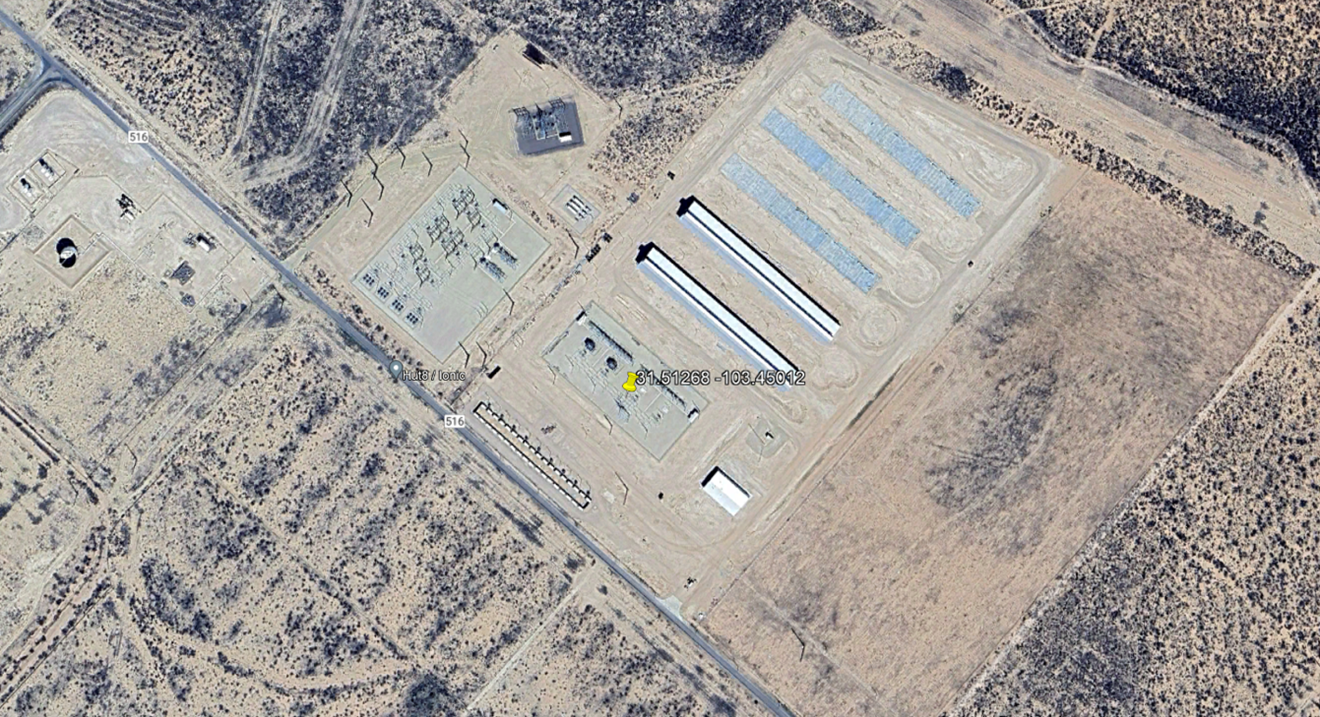
While it was data center and manufacturing growth leading to substation deployments in PJM and MISO respectively, ERCOT Load infrastructure activity was dominated by bitcoin mining in ERCOT. Public Service of New Mexico’s Texas New Mexico Power (TNMP) has been particularly accommodating in building new substations specifically to serve bitcoin mining load. The access to market-based Real Time pricing ERCOT wide has allowed the arbitrage between bitcoin pricing and mining efficiency (hash rate) and power prices to provide an important alternative revenue stream for bitcoin miners. The most recent Quarter saw both a new data center as well as 3 bitcoin mining operations come online in ERCOT, (see HUT8’s Trestle Bitcoin facility near Pecos, TX connected to TNMP’s West Texas 138 kv lines below, both Clarity Grid and Google Earth images):
Noteworthy Examples of Generation Additions:
NYISO:
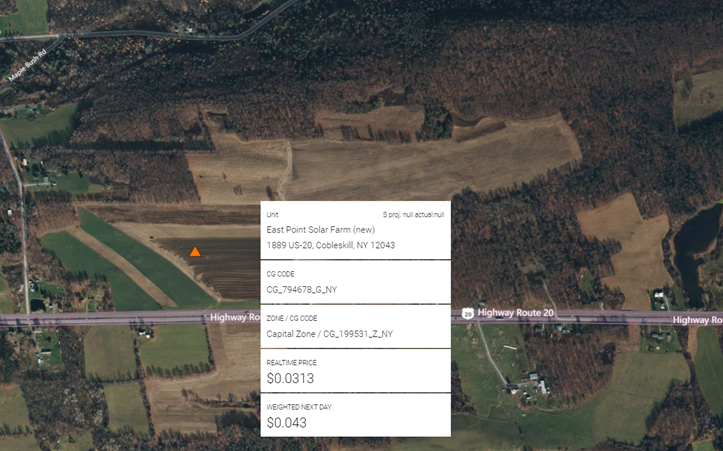
With the notable exception of natural gas fired generation projects added in CAISO EIM (to be discussed) and a small amount of Wind generation coming online in CAISO and MISO, it was exclusively Solar and Battery (much of it co-located) which accounted for additions to the Generation stack across the 7 US ISOs in 2Q. NextEra saw 2 projects come online in NYISO. The 50 mw East Point Solar facility in Cobleskill, NY is shown below:
PJM:
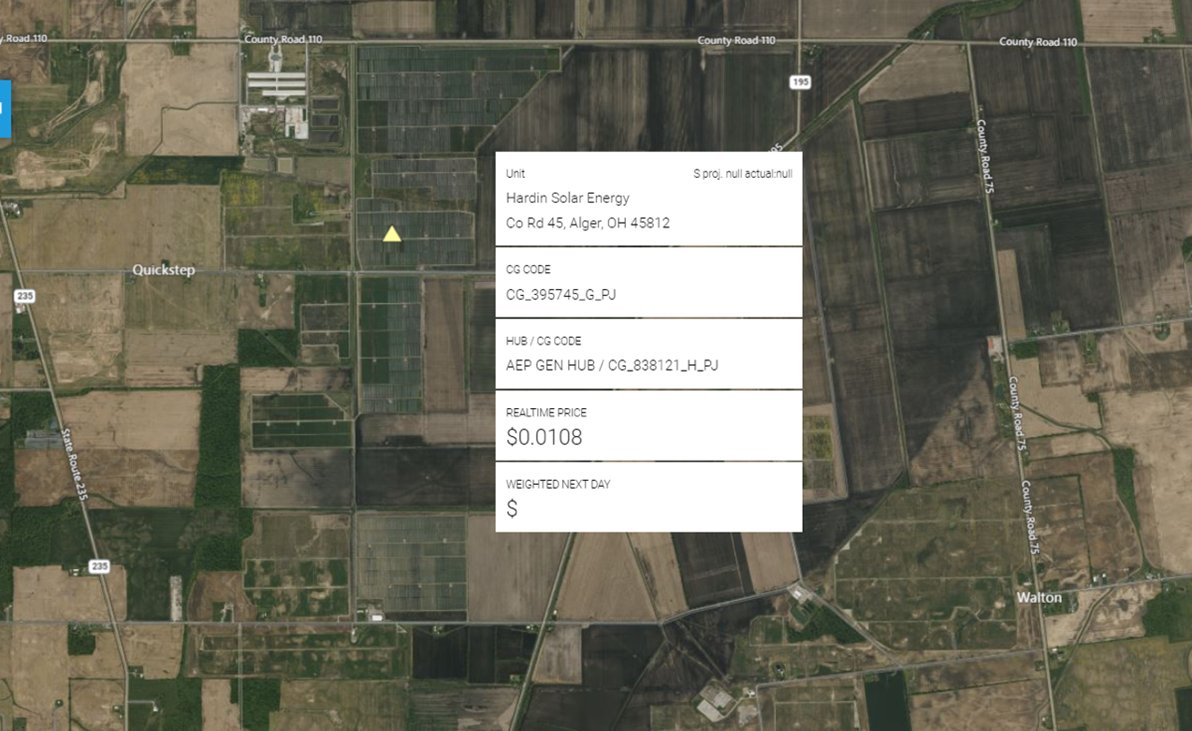
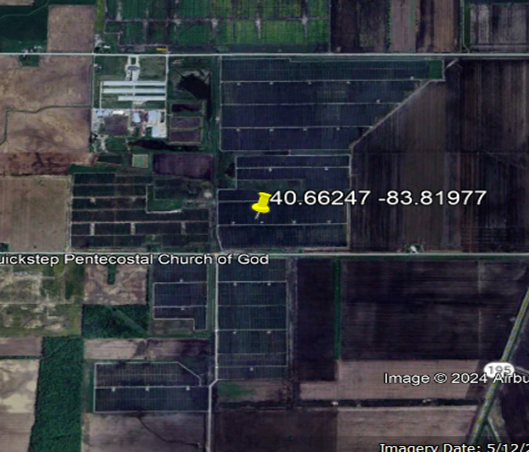
PJM saw 1,445 mws of new Solar come online over the Quarter with 19 new projects spread out across 7 States. One of the largest new projects was Invenergy’s Hardin Solar I, II, and II. The 150 mw Hardin I Solar farm in Dunkirk, OH is shown below):
MISO:
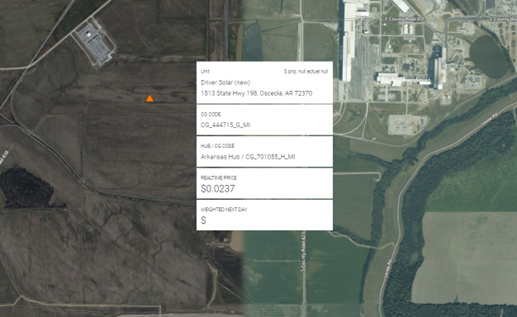
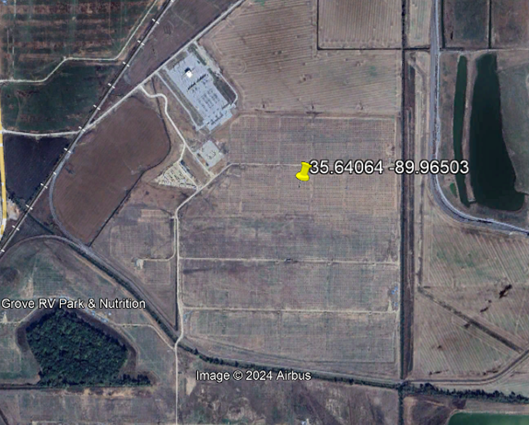
According to our PNode tracking methodology MISO recorded almost 1 Gw of new Solar Generation over the Quarter. The largest of these new facilities was Lightsource BP’s 250 mw Driver Solar connected to Entergy Arkansas 115 kv transmission network: (see both Clarity Grid and Google Earth images below with the beginning stages of development visible):
CAISO:
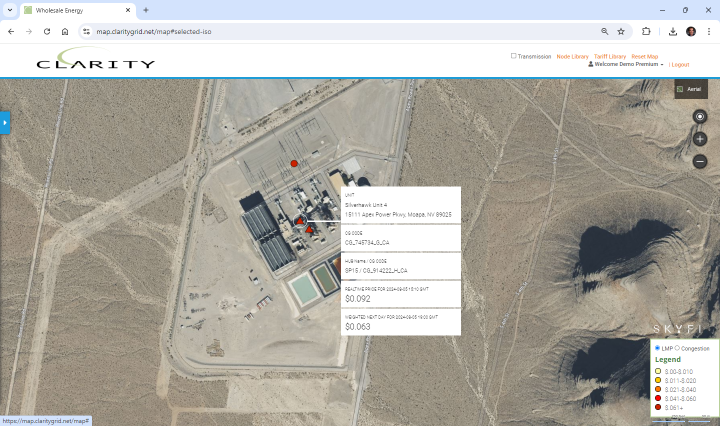
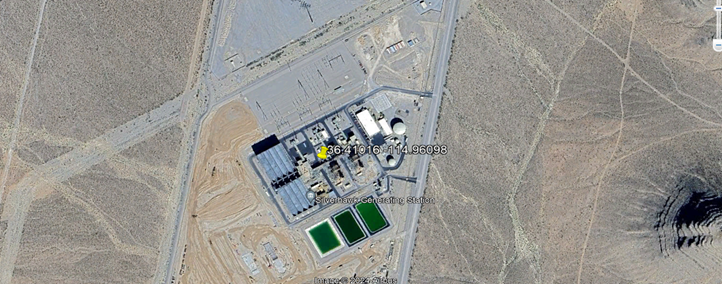
CAISO’s EIM territory followed up on last Quarter’s convertion from to coal to natural gas for Intermountain Generating Station commercial operation, with 3 new natural gas fired facilities; Apache Generating Station in Arizona, Yellowstone County Generation in Lander, WY and the Silverhawk Units 3-4 in Cochise AZ (shown below):
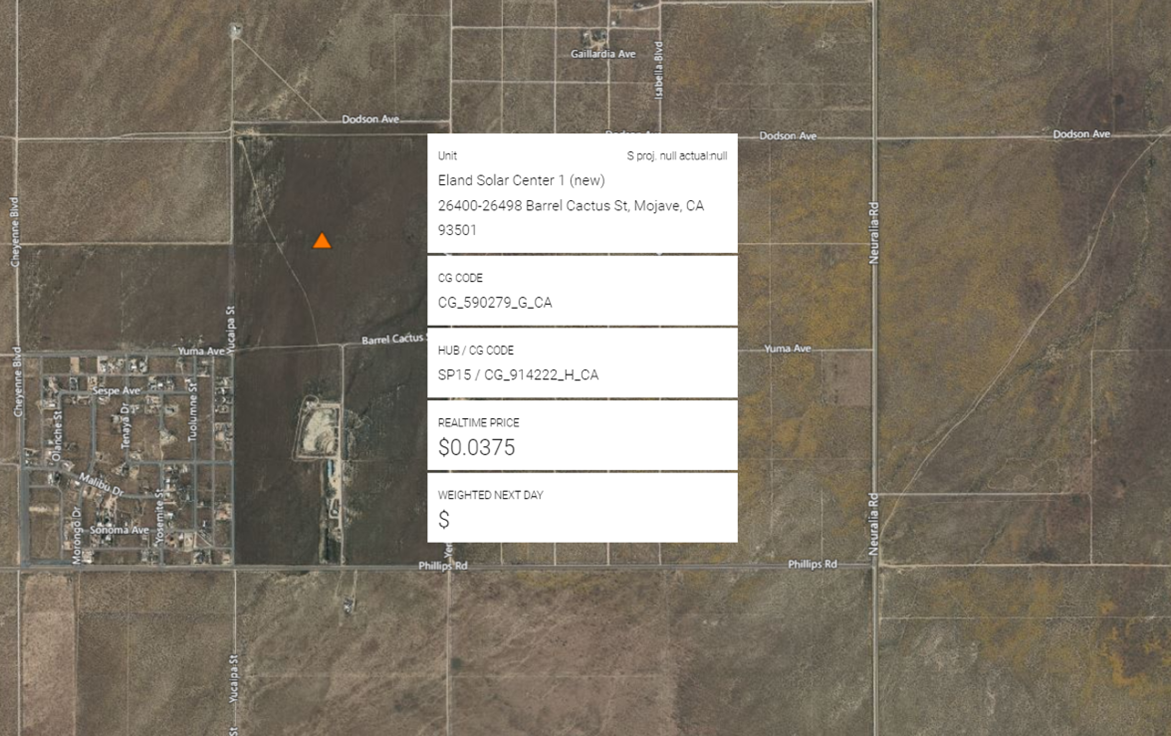
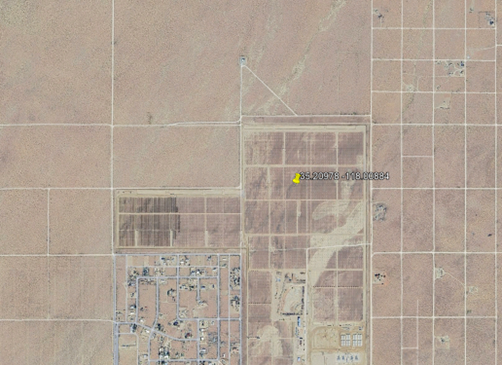
As noted previously, CAISO again dominated Solar capacity additions over the Quarter adding 2,360 mws, by far the largest addition of any ISO or Fuel category for Generation. These projects are typically tied to large Battery projects as well which explains a large and somewhat greater addition of 2,633 mws of Storage additions. Shown below is 8minute Solar Energy’s 75 mw Eland Storage Center 1, one of two new Eland Storage projects to come online over the Quarter.
ERCOT:
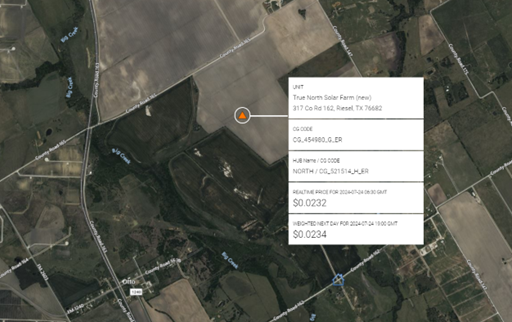
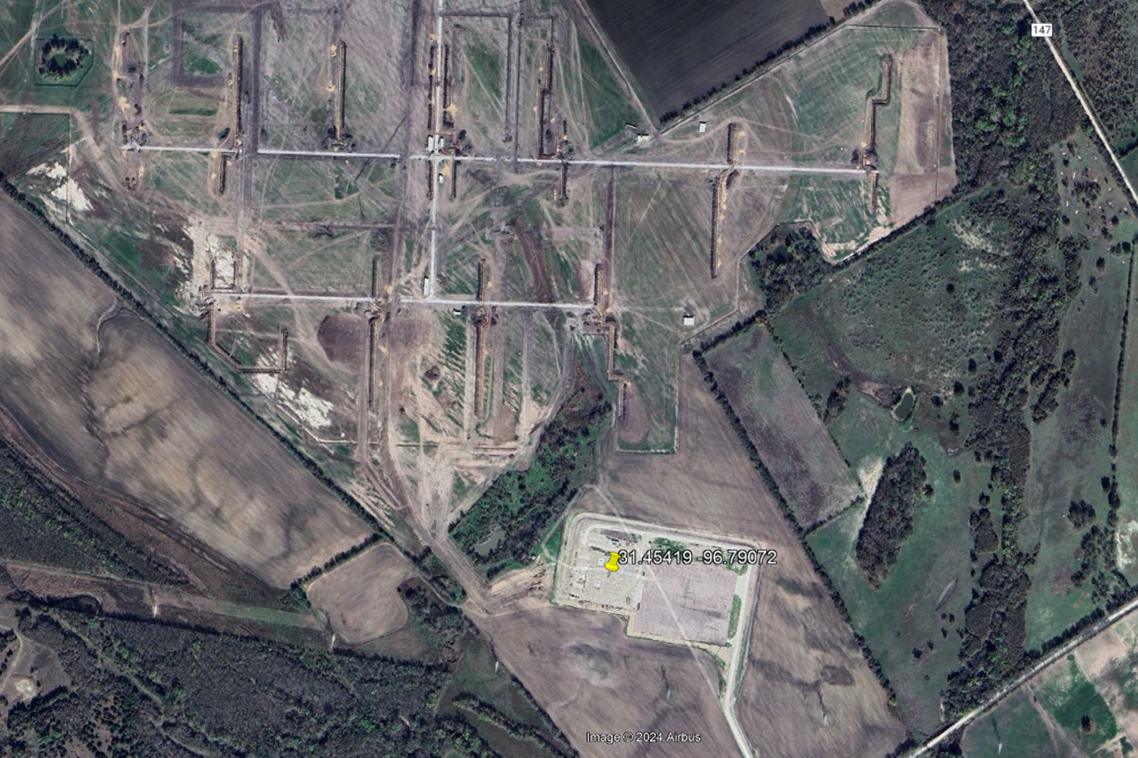
Amongst all ISO Regions, ERCOT is probably the most scrutinized area of the market by Grid stakeholders. This is due to the historic volatility of price due in part to the absence of any capacity payments which may act as a kind of standby insurance as well as fewer restrictions on permitting and interconnection of new generation and storage projects. Affordability of land and strong overall economic growth also play a role. While growth in both Load, Generation and Storage infrastructure has been torrid over the last several Quarters, there are indications that this is moderating. Over the recent Quarter several large Solar facilities did come online from a PNode perspective totaling 1,393 MWs, one of the largest projects to come online, Avangrid’s 238 mw True North Solar is shown below with Oncor’s 345 kv True North Substation visible to the Southeast (Clarity Grid and Google Earth views):
In examining the INR information on Al Pastor BESS, the Project first appeared on the Reports in May of 2022 and last appeared in February of 2024 with a Projected COD date at the time of 8/15/2024 and Actual COD of 7/15/2024 for a total period of development of just over 2 years. This compares to an average period of 3-4 years for Solar projects examined. We will be employing this historical data to more accurately predict the potential of new projects to make their way onto the Grid in ERCOT and other ISOs.
ERCOT INR Reporting by Resource Type:
Within the closely watched ERCOT Market, perhaps the segment that garners the most attention has been Grid-based Storage. This is at least in part due to the large amount of capital which has been deployed for new projects over a relatively short period of time (2020 to present). As mentioned last Quarter, Clarity Grid has aggregated historic development and applications for all types of Resource Development (INR) going back to 2020. Through a combination of data aggregation and visualization, Clarity’s Platform offers a historic “snapshot” of existing generation/storage as well as planned generation/storage has been developed (see example screenshots of Storage 1Q 2020 and Storage 2Q 2024 below). Triangles represent existing facilities, squares projects in application phase.
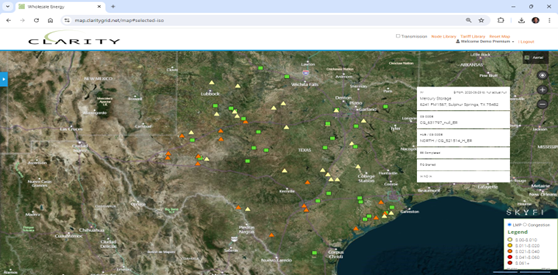
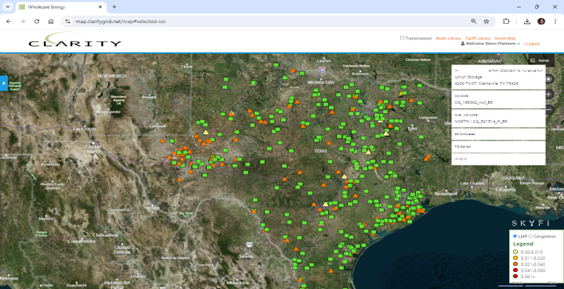
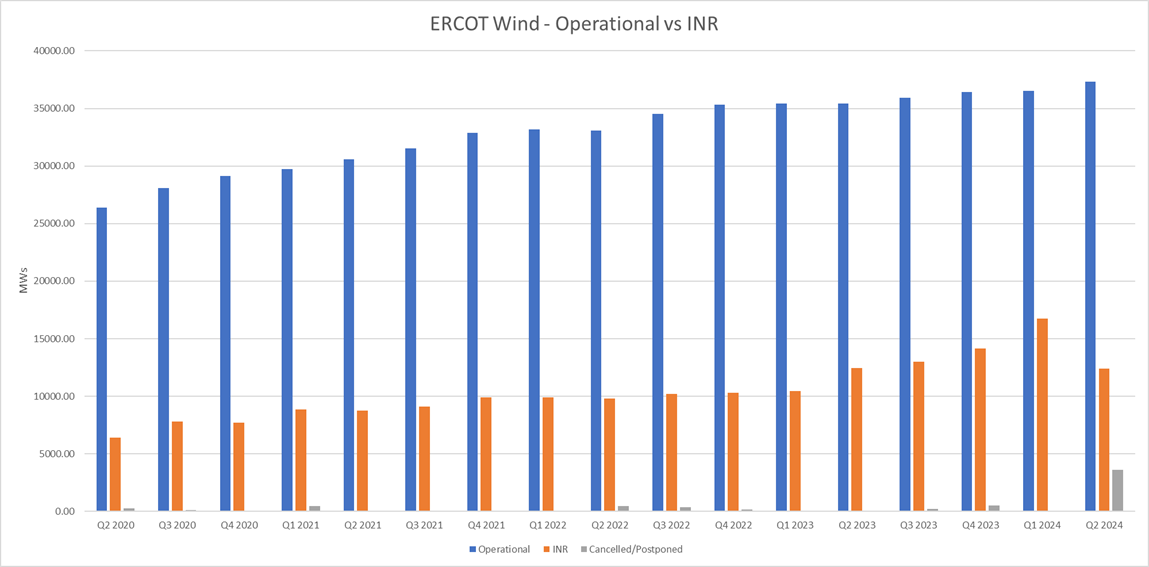
By tracking the progress of ERCOT Resource development from the application to the commercial operation (or abandonment) phase and focusing on key indicators of success such as Security Screening (SS), Full Interconnection Study (FIS) or Interconnection Agreement (IA) a better forecast of the future state of the ERCOT Grid can be realized. Other metadata, such as the generation or storage capacity of the future project and a timeline for the planned completion date, further enriches this forward-looking view of the grid. Charts 5-7 shown below provide a visualization of the Operating vs Application (INR) mw data available by Quarter and Resource Type on the Clarity Platform. Projects deemed to be abandoned or delayed are shown in the grey bars.
Key Chart Metrics:
– While the level of Operational Storage in ERCOT has grown briskly since 2020 and now registers 6,926 mws the amount of storage capacity and projects still seeking interconnection is massive, over 60,000 mws in Q1 2024, and only recently shows signs of leveling off.
– Solar began 2020 from a stronger installed base and has grown more steadily registering 23,403.57 mws at the close of this Quarter, the level of capacity in the queue (INR) has been more volatile, increasing strongly in the second half of 2022 and only recently showing signs of declining.
– Wind capacity began 2020 at a significantly higher base than Solar but has grown much more slowly over the period finishing this Quarter at 37,319 mws. However, the amount of capacity in the queue (INR) has remained far below installed capacity and shows signs of reaching a plateau.
Chart 5
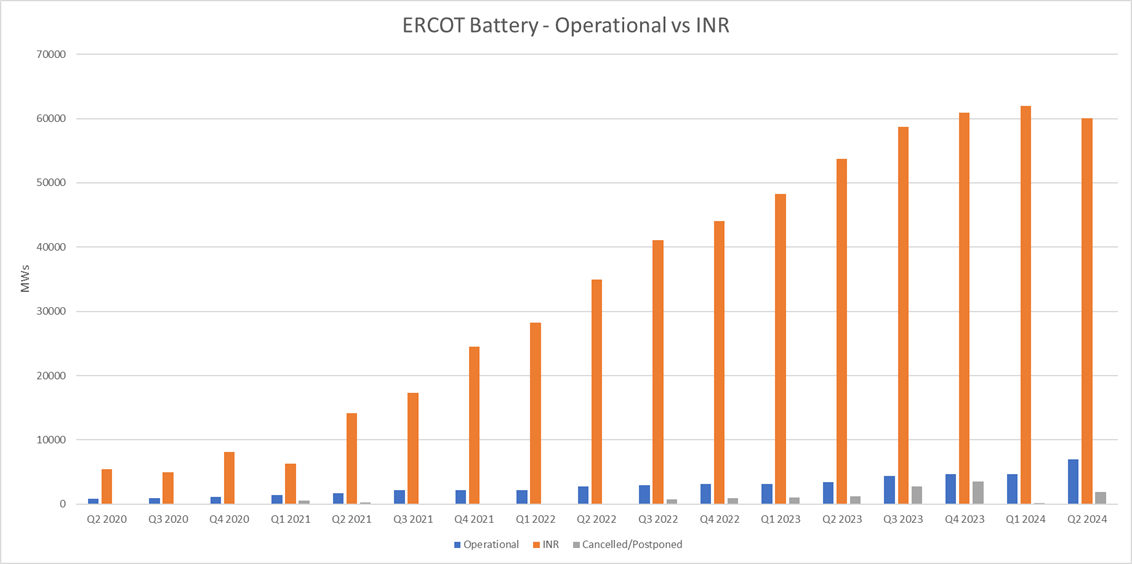
Chart 6
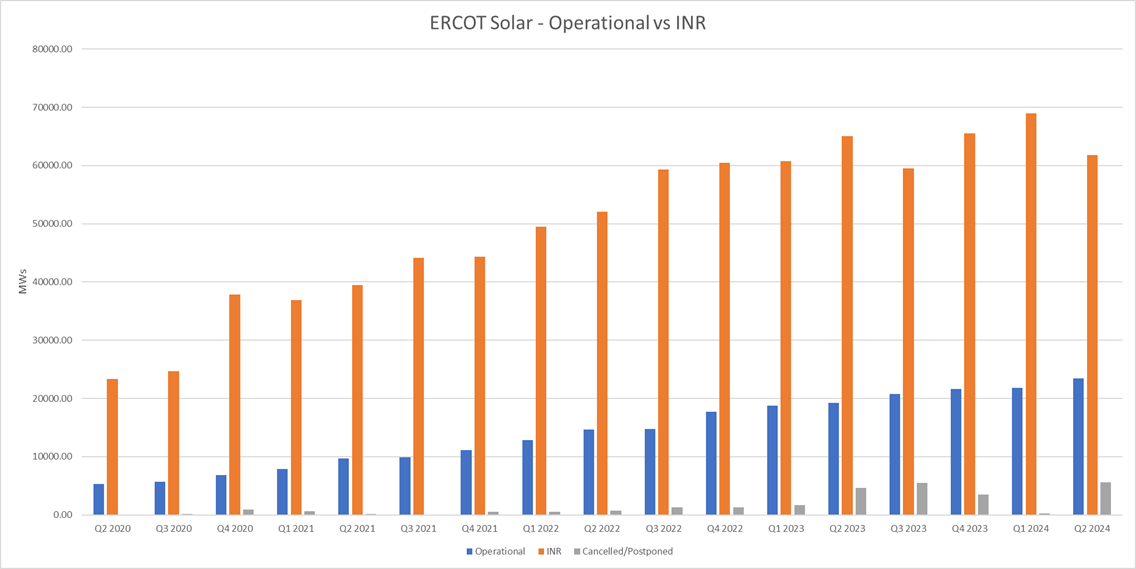
Chart 7
If you are interested in viewing all existing and new load and gen facilities, please inquire about a trial at https://www.claritygrid.net and select “Request a Demo.”

