Executive Summary
ISO PNode counts for the 7 US ISOs grew by 1,532 during the second Quarter of 2023, 1,287 for Load and 245 for Generation, bringing Total PNode counts in Clarity’s database to 76,397. While last Quarter’s node growth was driven by EIM additions in CAISO, this Quarter SPP’s EIM (WEIS) was the principal driver of node additions largely due to the addition of Public Service of Colorado (PSCo’s) network assets into SPP’s WEIS Market. Outside of the addition of existing assets into EIM market structures, ERCOT again led both Load and Generation additions with significant additions of Solar sites often paired with new substation and storage facilities. Also, in keeping with the trend of recent quarters, ERCOT added significantly to both its Load (Substation) infrastructure as well as Generation mix with predominantly new solar and battery assets. Notably, data center load growth (chiefly bitcoin mining in West Texas and South Dakota) drove new substation additions, some of which were independently owned but nevertheless identified by Load Name. Outside of these areas, with the exception of notable new generation and storage additions in NYISO, CAISO was the only ISO to add significant assets to the Grid, chiefly through solar and battery additions, and interestingly a new natural gas facility. Also, while not newly built, NYISO’s new initiative to spur distributed generation and storage development (DERs) has led them to produce LMP pricing at 131 existing transmission substation locations “transmission nodes” across the state. For the first time this important segment of the NYISO grid is now viewable and affixed with the same pricing and metadata as other load/gen points viewable on Clarity. Lastly, we are initiating a new partnership with Skyfi, an innovative new satellite imaging company, to enhance Clarity’s offerings, see an example in our ERCOT Load Additions discussion below.
Background
As first described in the 1st Quarter 2023 Blog piece, for those unfamiliar with the operations of the wholesale energy markets in the US, Independent System Operators (ISOs) are quasi-governmental agencies charged with managing the flow of electricity on the wholesale electric grid both safely and at the lowest cost. The models which ISOs use to schedule these transactions are frequently referred to as SCED or Security Constrained Economic Dispatch, emphasis on Security and Economic. This process is run much like an auction, administered by the ISOs, in which grid stakeholders: suppliers (generators), transmission entities, and those parties serving customers (load) all submit bids for which they are willing to transact for either the following 24-hour day (Day Ahead), or the next 5 minutes (Real Time). The price that all parties agree to transact is made public and available from the respective ISO’s website, but in an opaque form known as a PNode, or Price Node. This reflects the official price as certified and cleared by the ISO at which the sale, or purchase of power takes place at a discrete location. Because the value of electricity is chiefly defined only by its location, and storage of electricity was difficult and uneconomic until recently, it is very important to match the published price at a PNode to its location. Unfortunately, the structure of PNode information makes it very difficult to interpret, and often various types of metadata are required to understand the context of the price for a PNode, to begin to decipher its role on the grid and or location. Some PNodes only reflect the average value for many discrete locations across a geographic region (Zones) or for a group of related generation stations (HUBs), some simply measure flows of electrons at a point (Interfaces), etc.
Recent Developments in ISO Pricing
While each of the 7 US ISOs have their own set of priorities and market structure, there are two noteworthy themes which warrant mention. The first is the evolution of “integrated” markets which expand the traditional geographic region of the ISO, most noteworthy being CAISO’s EIM and SPP’s WEIS. Fundamental to any theory regarding the benefits inherent in a “network effect” is that the greater the size of the network, the greater the benefits that may be derived from increased efficiency in the operation of the network as a whole. Recognizing this, CAISO was the first to establish a market which included generation assets outside of the State of California in their dispatch modeling (SCED). In this way, the wind and solar assets of the Mojave Desert and the coal plants of Wyoming both compete on price to serve load in the broad area of what was often referred to as WECC, a large area incorporating most of the US Western States.
The second major trend changing the role of ISO pricing (LMPs) is the evolution of distributed generation and storage which change the way in which these prices are used for settlement. Fundamental to ISO pricing methodologies has been the different treatment that Load versus Gen prices have been employed by each of the ISOs. While Gen (Generation) assets have always bid into markets and been compensated at a specific price (LMP) for their service, Load points assigned prices (LMPs) are muted by the fact that they serve only as one component of a calculation for an average set of prices across a broad geographic region, i.e., Load Zones. Therefore traditionally, the market largely ignored these prices as they were not “actionable”. However, most notably in ERCOT, ISO protocols have permitted new generation or more importantly, storage assets, to settle both sales and purchases at what before were merely load node prices. This opens up the possibility of actually being “paid” to consume energy under negative pricing events. It also dramatically increases the importance of all LMPs (not just those associated with Gen) produced by the ISOs in both Next Day (ND) and Real Time (RT) optimization. It should be noted that while ERCOT’s pricing methodology for distributed resources is the most evolved, each ISO is examining and treating settlement for these resources in its own manner. For example, NYISO has now identified 130 substations connected at the transmission level at which distributed generation will now have an LMP calculated which will be employed directly into generation and storage settlement. Both of these trends described above obviously increase the importance of understanding the current state of both the physical assets on the Grid, as well as associated pricing.
Clarity PNode Additions
As described in previous Blog postings, it is important to understand the context of new PNode additions on a quarterly basis. While the overall count of PNodes may go up, it cannot be assumed that new infrastructure has been added to the Grid to generate, store, or deliver energy. New nodes may appear for essentially four reasons: 1) Additional capacity (transformers) are added to existing substations and awarded a new unique PNode, 2) Previously existing substations are added to a Utility’s PNode library, presumably to enhance price discovery and accuracy, 3) New Utility systems are added to an ISO’s PNode library to support the functioning of an integrated market as described above for EIM an WEIS, or 4) New facilities are in fact added to the Grid to service the market. It is obviously the last category that stakeholders value the most in determining how grid dynamics are changing.
The distinction between newly added and truly new additions can be seen by comparing the 2 Charts below:
Chart 1
2Q 2023 Notional Node Additions
| NYISO | NEISO | PJM | MISO | SPP | ERCOT | CAISO | Total Fuel Type | |
| Solar | 1 | 0 | 0 | 0 | 18 | 8 | 21 | 48 |
| Hydro | 0 | 0 | 0 | 0 | 4 | 0 | 0 | 4 |
| Natural Gas | 1 | 0 | 0 | 0 | 85 | 4 | 3 | 93 |
| BM | 0 | 0 | 0 | 0 | 1 | 0 | 2 | 3 |
| Battery | 3 | 0 | 0 | 0 | 2 | 17 | 25 | 47 |
| Wind | 1 | 0 | 0 | 0 | 29 | 0 | 4 | 34 |
| Coal | 0 | 0 | 0 | 0 | 2 | 0 | 0 | 2 |
| Distillate | 0 | 0 | 0 | 0 | 14 | 0 | 0 | 14 |
| Geothermal | 0 | 0 | 0 | 0 | 0 | 0 | 0 | 0 |
| Total ISO | 6 | 0 | 0 | 0 | 155 | 29 | 55 | 245 |
| NYISO | NEISO | PJM | MISO | SPP | ERCOT | CAISO | Total Load | |
| Load | 130 | 0 | 0 | 0 | 673 | 289 | 195 | 1287 |
Chart 2
2Q 2023 Newly Constructed Node Additions
| NYISO | NEISO | PJM | MISO | SPP | ERCOT | CAISO | Total Fuel Type | |
| Solar | 1 | 0 | 0 | 0 | 0 | 8 | 8 | 17 |
| Hydro | 0 | 0 | 0 | 0 | 0 | 0 | 0 | 0 |
| Natural Gas | 0 | 0 | 0 | 0 | 0 | 4 | 1 | 5 |
| BM | 0 | 0 | 0 | 0 | 0 | 0 | 0 | 0 |
| Battery | 3 | 0 | 0 | 0 | 0 | 17 | 14 | 34 |
| Wind | 1 | 0 | 0 | 0 | 0 | 0 | 0 | 1 |
| Coal | 0 | 0 | 0 | 0 | 0 | 0 | 0 | 0 |
| Distillate | 0 | 0 | 0 | 0 | 0 | 0 | 0 | 0 |
| Geothermal | 0 | 0 | 0 | 0 | 0 | 0 | 0 | 0 |
| Total ISO | 5 | 0 | 0 | 0 | 0 | 29 | 23 | 57 |
| NYISO | NEISO | PJM | MISO | SPP | ERCOT | CAISO | Total Load | |
| Load | 0 | 0 | 0 | 0 | 9 | 87 | 1 | 97 |
As can be seen from a comparison of the 2 Charts, while notional additions grew by 1,532 (1,287 Load and 21 Gen) newly constructed nodal points only registered 154 (97 Load and 57 Gen). This was due to large nodal additions of previously constructed infrastructure, i.e., substations and generation, which represent the networks of newly added utilities in SPP’s EIM, most notably PSCO and WAPA’s Colorado Missouri LBA (WACM) network additions.
Newly Constructed Generation (Storage) by Fuel Type
Examining only PNode additions is obviously insufficient when trying to understand the impact on the Grid of infrastructure additions, the size (mw or kv) must also be understood. As mentioned, the largest growth in both generation as well as storage assets has been “distributed” which by definition is smaller in scale.
Chart 3
2Q 2023 Newly Constructed Node Additions (mw)
| NYISO | NEISO | PJM | MISO | SPP | ERCOT | CAISO | Totals | |
| Solar | 27.00 | 0.00 | 0.00 | 0.00 | 0.00 | 1380.00 | 1464.00 | 2871.00 |
| Hydro | 0.00 | 0.00 | 0.00 | 0.00 | 0.00 | 0.00 | 0.00 | 0.00 |
| Natural Gas | 0.00 | 0.00 | 0.00 | 0.00 | 0.00 | 1058.00 | 48.00 | 1106.00 |
| BM | 0.00 | 0.00 | 0.00 | 0.00 | 0.00 | 0.00 | 0.00 | 0.00 |
| Battery | 42.00 | 0.00 | 0.00 | 0.00 | 0.00 | 331.50 | 1318.00 | 1691.50 |
| Wind | 106.00 | 0.00 | 0.00 | 0.00 | 0.00 | 0.00 | 0.00 | 106.00 |
| Coal | 0.00 | 0.00 | 0.00 | 0.00 | 0.00 | 0.00 | 0.00 | 0.00 |
| Distillate | 0.00 | 0.00 | 0.00 | 0.00 | 0.00 | 0.00 | 0.00 | 0.00 |
| Geothermal | 0.00 | 0.00 | 0.00 | 0.00 | 0.00 | 0.00 | 0.00 | 0.00 |
| Generation | 133.00 | 0.00 | 0.00 | 0.00 | 0.00 | 2438.00 | 1512.00 | 4083.00 |
| Storage | 42.00 | 0.00 | 0.00 | 0.00 | 0.00 | 331.50 | 1318.00 | 1691.50 |
Over the quarter, over 4.0 GW of generation and almost 1 .7 GW of storage was added to the Grid from a PNode perspective. As has been true for several quarters, ERCOT dominated additions of both new Generation as well as Load (serving) assets. However, it should be noted that almost half of the addition to the Generation stack was due to a large natural gas fired plant coming online in ERCOT (Front Energy Center in Mission, TX) and profiled below. Outside of ERCOT, CAISO saw some battery capacity (198 mw) added while NYISO saw three new battery projects added to the Gen stack as well as a large Wind farm.
Noteworthy Examples of Generation Additions:
NYISO
While NYISO has not traditionally been a driver of capacity additions to the US Grid, it did see several interesting developments over the Quarter. For example, below is a screenshot with pricing for Invenergy Service’s 106 mw wind farm in Lowville, NY and now operational.

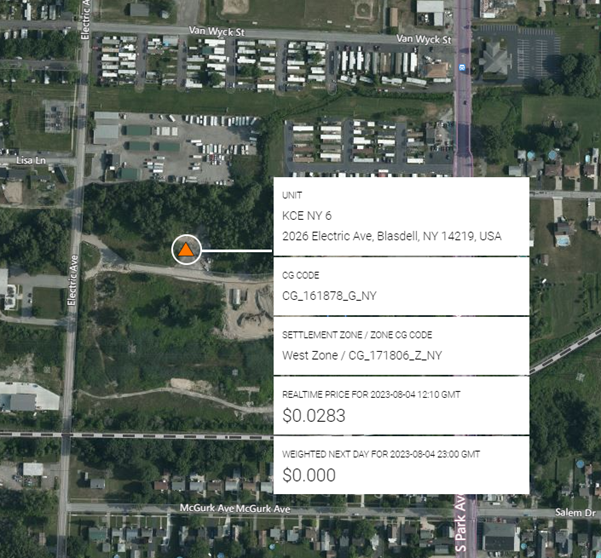
On the storage side, Key Capture’s KCE NY 6 20.0 mw storage facility in Blasdell, NY is visible in Bing Maps in construction phase due to satellite lag but appears operational on other GIS platforms.
CAISO
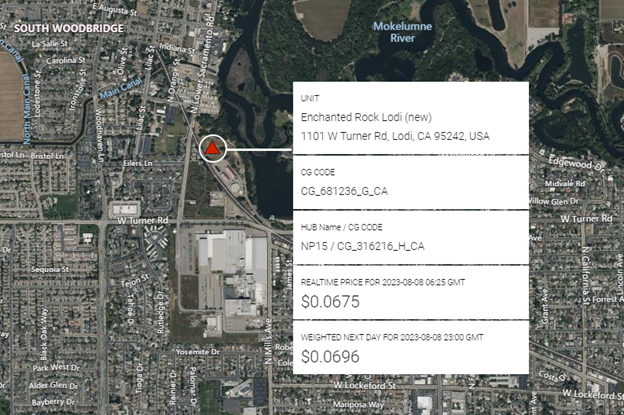
As seen from Chart 3 CAISO saw a newly constructed natural gas facility as Enchanted Rock (a Houston based operator known more for backup generation on customer sites) launched Enchanted Rock Lodi, a 48-mw generation unit (see below):
CAISO EIM:
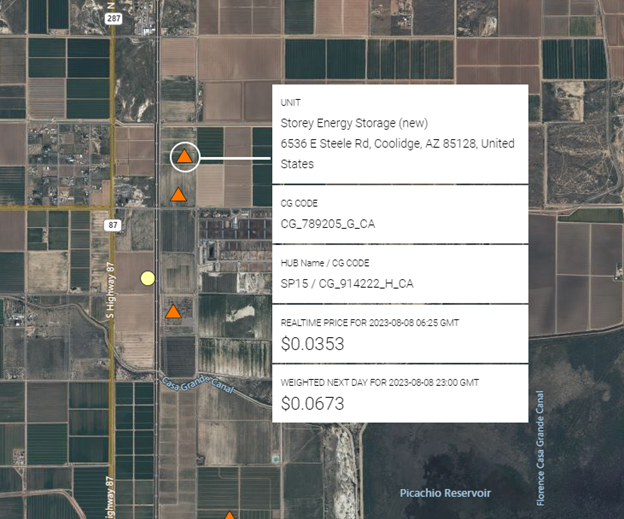
In APS EIM territory Storey Energy Storage at 88.0 mw is one of two large storage projects being developed by NextEra in the Phoenix area co-located with solar.
ERCOT
There was much activity in ERCOT over the 2nd Quarter as 17 new Battery sites were added, a total of 331 MWs (which under-estimates the count, as the mw capacity of 2 units was not available), and 8 new Solar facilities totaling 1,380 MWs were added. Lastly, Frontera Energy Center a combined cycle 529 MW facility in Mission, TX appeared as a new set of PNodes in ERCOT Gen as mentioned earlier.
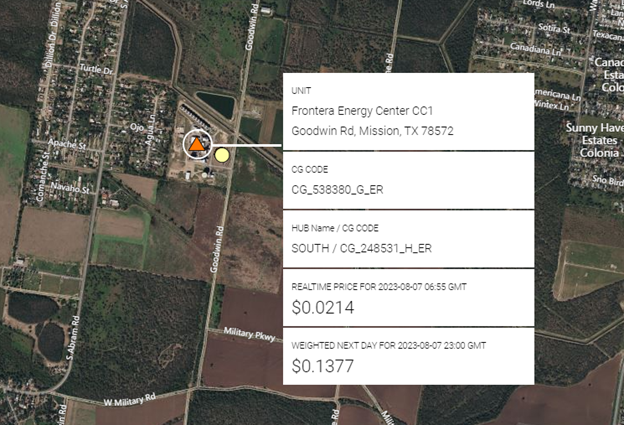
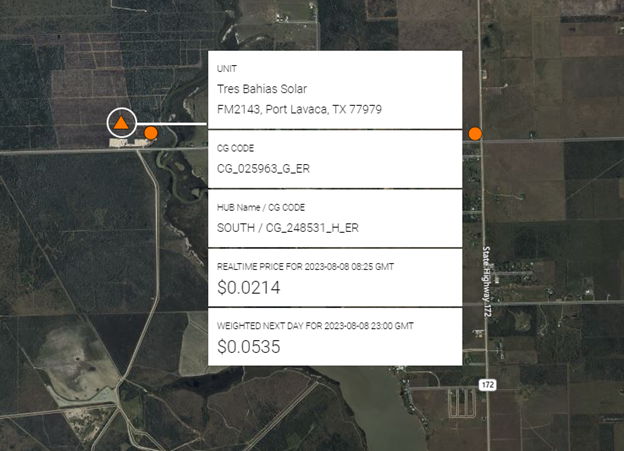
Shown below Tres Bahias Solar Farm being constructed by Swift Current Energy at 266.0 mw in Port Lavaca, TX, one of 8 new ERCOT Solar facilities to come online during 2Q 2023.
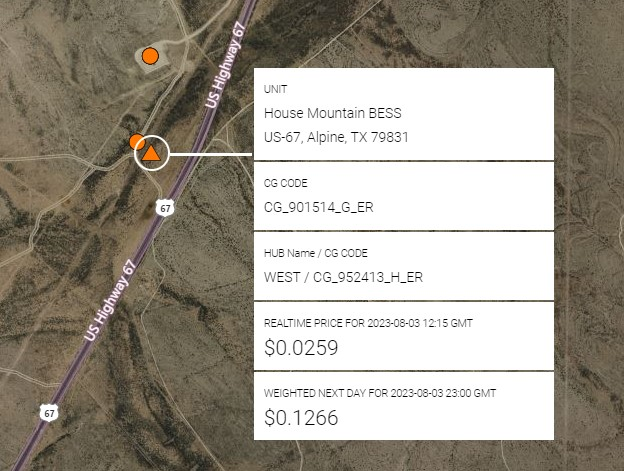
Shown below but not yet visible on Bing Maps is House Mountain BESS near House Mountain substation, a 62.3 mw 2 Hour Battery being constructed by Jupiter Power. This is one of 17 new battery projects awarded PNodes during the 2nd Quarter.
Noteworthy Examples of Load Additions:
As mentioned earlier, while the traditional focus of the industry has been on new and existing generation pricing locations, distributed generation and storage has led to greater interest on the more granular and numerous set of substations as potential points of interconnection. Coupled with the fact that these installations tend to be much smaller in scale and draw much less media and regulatory coverage, the task of filtering and identification of these facilities is much more difficult. Nevertheless, the addition of a large data center or bitcoin mining facility can significantly alter flows on the grid and therefore of interest to the broader market. Lastly, the additions of previously existing physical substations interconnected by transmission to an ISO’s daily LMP output can create price discovery at new locations which can be important for siting, FTR trading, and asset management.
NYISO
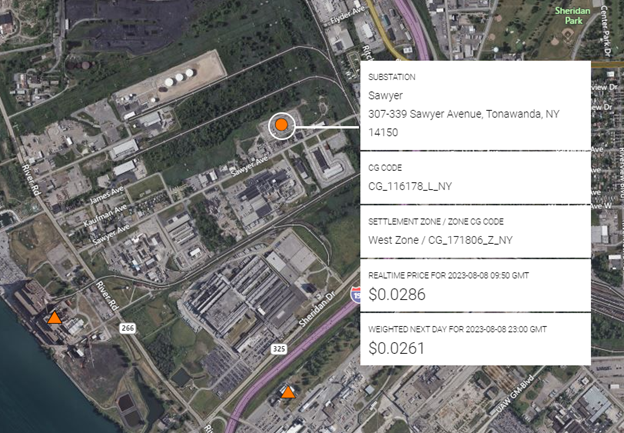
Seen below NYSEG’s Sawyer, one of the newly identified and mapped Transmission Nodes introduced by NYISO for DER aggregation.
SPP
As mentioned above, SPP’s WEIS market has seen significant growth in Utility membership in the past year and this past Quarter Xcel Energy’s Public Service of Colorado subsidiary was a significant addition to both SPP Load and Gen PNode libraries. This addition coupled with WAPA’s Colorado/Missouri transmission network and the previously added Colorado Springs Utility system earlier this year, means Colorado is meaningfully participating in SPP real time pricing and dispatch with the attendant price discovery.
Shown below high-level view of PSCo Denver area Nodal Network
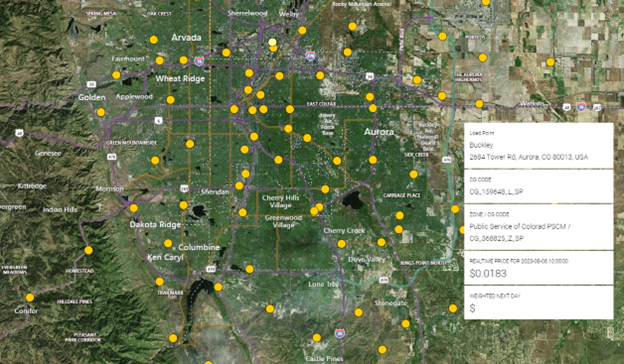
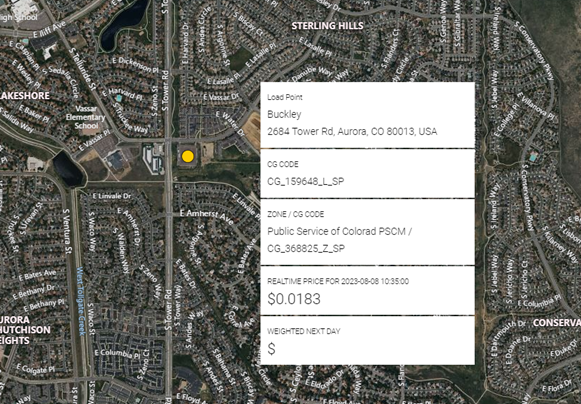
high-level view of Denver PSCO substation network newly added, and a more telescoped view of Buckley Substation in the Aurora suburb:
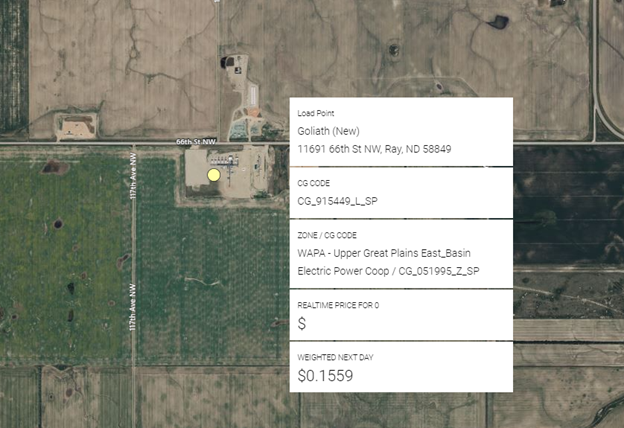
In addition to EIM infrastructure, newly constructed substations of note were added by the original utility membership in SPP. Seen below is the newly constructed and verified Mountrail Williams 115.0 kv Goliath Substation serving Williams Pipeline in Ray, ND.
ERCOT
As has been the case for several quarters, ERCOT saw the most dramatic increases in Load (Substation) activity over the past quarter. This increase was varied in size of substation capacity, from 34.5 kv to several 345 kv line transmission capacities, to use cases, co-located with new large solar or wind facilities, to meet new commercial/residential load growth, and most dramatically to support large new data center loads, primarily for bitcoin mining in West Texas at 6 TNMP Substations. In addition, large newly constructed substations are coming online exclusively to serve bitcoin mining activities near TNMP Cedarvale and a new substation, Rodeo Ranch, built exclusively to serve a large Storage facility near Worsham Substation.
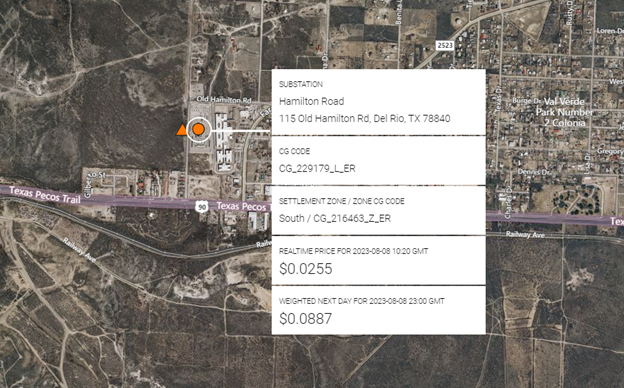
Seen below AEP’s new 138 kv Hamilton Road Substation built to serve load growth in South Texas:
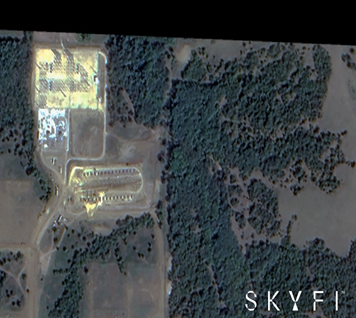
Lastly, Clarity Grid’s GIS Platform is housed on top of Bing Maps, what Bing Maps publishes is what you see on our site. Like all commercial services Google Maps, Apple Maps, etc., Bing satellite image vintages vary widely, from just yesterday (if you’re lucky) to several years ago. We obviously scan all the widely available commercial services for the latest images to verify new grid construction, in addition to a myriad of other sources in our library. However, heretofore our customers had to essentially “take on faith” that the location we identify for a new PNode’s location was in fact what you would see if the satellite image was current. However, we have partnered with a new Company, Skyfi, https://www.skyfi.com/ to allow our customers to seamlessly transition from our Platform to Skyfi’s fulfillment center, where either existing (but much more recent) images of new PNode locations at a modest cost, or new satellite images can be ordered for future (weeks) image capture. Look for the Skyfi URL on Clarity’s website soon.
Below is a good representation of a use case we ourselves experienced during the 2nd Quarter update. We initially determined that Oncor’s new 345 kv Birthright Switch Substation was in the Sulphur Springs, TX area. However, readily available satellite images only yielded what looked like early substation construction activity as seen below:
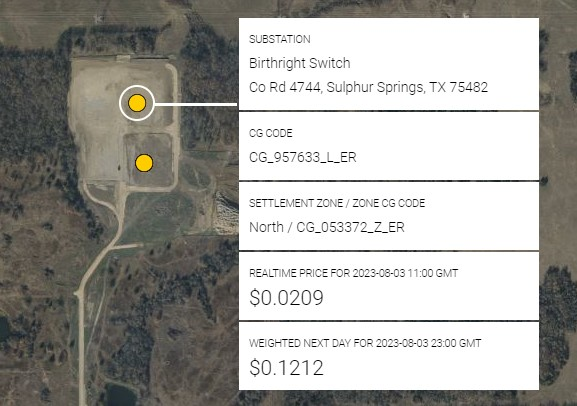
We worked with the Skyfi Team to identify the specific area of interest from an image in their library from late 2022. The more current image matching the acreage of the screenshot of the Clarity site is shown below with the Birthright Switch clearly visible as is the Cyclone Substation just below it and serving the Bright Arrow Solar facility (both previously identified by Clarity) now visible as well.
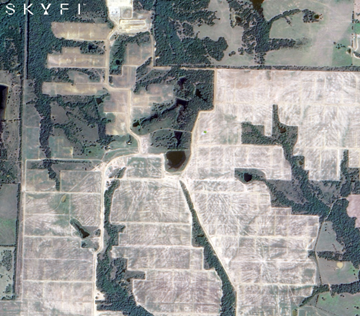
Finally, a wider shot (right) of the larger area shows both Substations to the north and the build out of Bright Arrow Solar taking up a large area directly to the south.
If you are interested in viewing all existing and new load and gen facilities, please inquire about a trial at https://www.claritygrid.net and select “Request a Demo.”

