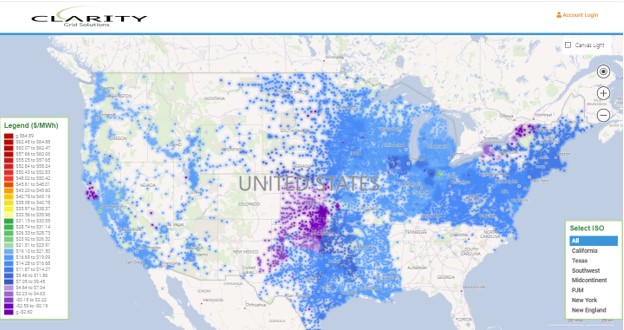
Due to the steady decline in battery storage costs and increasing integration into renewable energy systems, interest in prime locations has grown exponentially. Prior to undertaking the cost of interconnection, developers must first identify the most attractive locations as defined by; hourly energy prices, substation capacity available, and or incremental planned load and generation which may impact future prices. Since interconnection is possible at both existing generation and load nodes, a proper analysis requires examination of pricing at both. This can be an overwhelming data exercise as each hour is priced separately and the number of load nodes far exceeds the number of conventional generation nodes. For example, in ERCOT, generation nodes only account for approximately 700 of the roughly 15,000 nodes ERCOT publishes daily. In addition, ERCOT publishes this data in its raw pnode format which must be translated to provide useful information such as Common Name, or Address. Lastly, this data is constantly revised to eliminate old nodes going offline and the addition of new nodes being brought onto the Grid.
Clarity has aggregated, translated, and maintains a complete nodal database of pricing for all seven US ISOs. The data has broad applicability to decision makers operating on the US Grid and one of the most popular is determining optimal battery locations. Clarity has undertaken a study of the ERCOT Grid to identify such locations. The methodology for this determination is fairly well established, for each node find the optimal injection and withdrawal hours within a day given the battery’s functionality and size and simulate this dispatch over a period. It should be noted that in ERCOT, as well as other ISOs, there is active discussion of the appropriateness of a Battery paying either the nodal or zonal price for charging, it was assumed for the simulation that a Battery granted nodal status for discharge would also pay nodal prices for charging. For the sake of our review, we assumed a 1 mw battery with 2 hours of injection and withdrawal over the calendar 2019 period as well as the 2020 calendar period to date. We only analyzed economics of the battery for energy value, ignoring the various categories of ancillary services revenue potentially available for simplicity. In addition, we reviewed only Next Day hourly pricing data and not Real Time due to data limitations. As Real Time data is generally more prone to price spikes, we can generally assume that the value of the battery would have been even more valuable when dispatched in Real Time. Lastly, as perfect dispatch strategy is only known in hindsight, we reviewed all consecutive 2 hour time sets within a day over the entire period and determined those sets of minimal (injection) price hours and those sets of maximum (withdrawal) hours which were most frequently observed to determine optimal locations and dispatch strategy if undertaken for the full period.
Calendar 2019 Results
For the full 2019 calendar year a review of the data shows that there were three distinct regions where a battery would yield the highest returns. These were 1) Central/West Texas south of Abilene, 2) Far West Texas near the Panhandle, and 3) Southeast Coastal Texas southwest of Houston.
- Central/West Texas: Top performing nodes for this region included: Gouldbusk, Valera, Talpa Atlantic, and Novice, both Valera and Novice being close to Coleman, TX. Average hourly price spreads in this Region were all in the 21 cts/kwh region and optimal strategy called for injection from 02-04 hours and withdrawal during 16-18 hours.
- Far West Texas: Top performers in this region were: the set of Notrees nodes including Notrees Switch, and Notrees Wind Farm for both load and gen nodes which average around 20 cts spreads. Optimal injection for the Notrees nodes was 10-12 and withdrawal from 19-21 hours,. Also included in this set were the E&P locations for Dollarhide and Amoco Three Bar which benefited from negative prices during the optimal injection hours of 4-6 and withdrawal from 15-17 hours, and which averaged in the high teens spreads.
- Southeast Coastal: Top performing nodes for this region included: Van Vleck and Bay City subs whose spreads averaged in the mid-teens. Optimal injection withdrawal was again 2-4 and 15-17 withdrawal.
Calendar 2020 Results
Performing a similar analysis for the period of 2020 to date did not significantly impact the top performing nodes with the exception of the Central/West region which moved to the bottom of the stack. With the provision that only the top 100 nodes from the 2019 study were analyzed for 2020, the West Texas Region yielded the strongest results with sets of two hour spreads approaching 40 cts for the Notrees nodes and Cheyenne from this Region also making the top ten. Nodes from Southeast Coastal moved into the single digits without the benefit of high summer prices. As to dispatch strategy, Far West data dictated a shift in both injection and withdrawal of a few hours with 12-14 and 18-20 yielding the best results respectively.
Complete the form below to get the full results of the study for 2019 and 2020 periods. Thanks!