Kevin P Hannon
March 11, 2020
Each of the 7 US Independent System Operators (ISOs) establish daily or hourly pricing for the markets they serve by balancing supply and demand at over 60,000 pricing points across the US. This process, called Security Constrained Economic Dispatch (SCED), begins at the lowest physical levels of the electric grid where substations for load and electric plants for generation submit bids and offers for power. The formats used to publish these prices vary widely by ISO and usually cannot be interpreted easily. Clarity has gone through the painstaking process of translating the arcane language of price nodes “pnodes” into useful information such as Common Name and Location. Armed with the Location, we can then correlate each of these prices to our database and track pricing on a local level in all areas of the US where ISOs operate. This can be seen most clearly on Clarity’s heat map https://map.claritygrid.net/scatter-map.
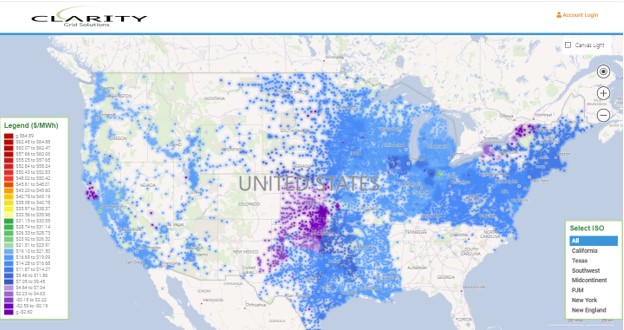
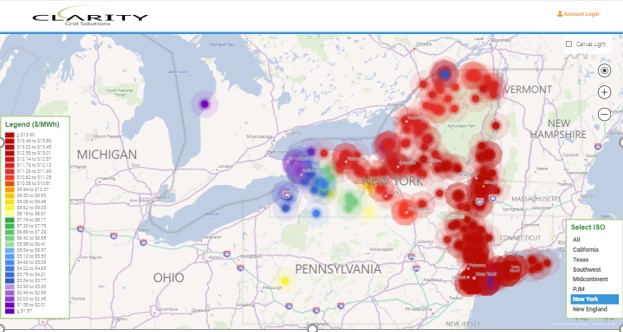
The National view shown above demonstrates where there is price availability throughout the US and where there is not. As you can see, the Southeastern US and large swaths of the West are devoid of ISO pricing for power. Using the Pricing Scale to the left of the Chart most power is priced in the high teens or lower twenty dollar per megawatt hour territory. However, since all pricing must fit into the Pricing Scale shown, much of the nuance of pricing on a regional basis is lost. For example, if we choose only NYISO (shown below), we see that pricing varies more dramatically across New York State. While most prices fall into the low or mid-teens we see that power in Western New York State registers less than $5 per megawatt hour. No doubt benefiting from some of the cheapest hydroelectric power in the world next to Niagara Falls!
This phenomenon is not confined to NYISO as a unique confluence of circumstances can routinely drive power prices negative (yes, you can be paid to use power!). For instance, below is another heatmap of pricing in the Southwestern Power Pool (SPP). Central Kansas has seen the introduction of an abundance of new wind farms, Cimarron Bend, Bloom, and Flat Ridge to name a few.
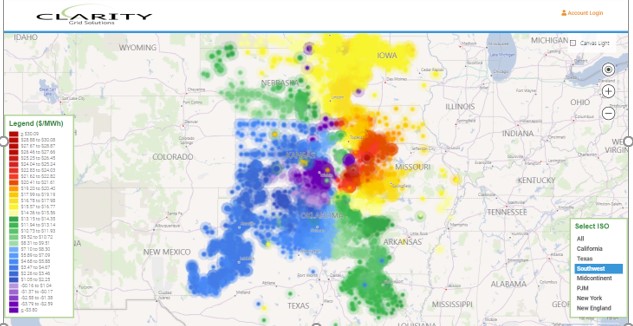
These facilities operate at almost zero marginal cost when the wind is blowing, and the Investment Tax Credit makes production economically viable at the negative prices shown in purple.
The full heatmap of the US can be accessed without subscription from Clarity’s home page? Unlike individual ISO websites, we present each ISO’s pricing using the same standard mapping format, all in one place. Check it out.