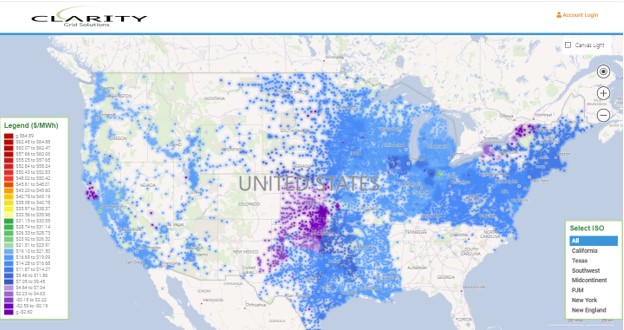
Deregulation of electricity markets is determined at the State level in the US. Currently 15 states (30%) provide for at least some, or all, customer classes to purchase power on a deregulated basis. However, because this group includes the relatively populous states of New York, Texas, and Illinois the percentage of the market which is deregulated approaches 35%. Under this framework, it is only the Energy portion of the bill, which is subject to competition, with the Distribution (last mile) cost of delivery regulated by the State Public Utility Commission (PUC). Also, most consumers do not realize that Cooperatives and Municipal Electric Distributors are not subject to PUC or State regulation even in otherwise deregulated states. Therefore, the Distribution components of the bill which typically include; a) Monthly Cost in dollars per month, b) Distribution in $/kwh, and c) Demand Charges in $/kw for mostly Commercial/Industrial customers, usually include many line items which reflect charges mandated by State regulators which are outside of a pure cost of service.
Understanding each of the components of electric billing requires a detailed breakdown of individual line items which may be buried in tariff documents measuring hundreds of pages long. In addition, these charges may change as frequently as every month requiring almost constant attention. The sheer number of Utility Distributors and Tariffs make this a daunting task. However, effective audits of customer billing as well as the tracking of high demand periods and peak (demand) charges require this level of detail. Demand charges alone can easily approach one third of a large customer’s monthly bill, making effective identification and measurement of such costs an important part of energy management overall. Also, in some cases customers may be eligible to enroll in alternative tariffs, such as Time of Use (TOU) and a granular line item detail of billing is necessary to determine which tariff is the most cost effective for the customer.

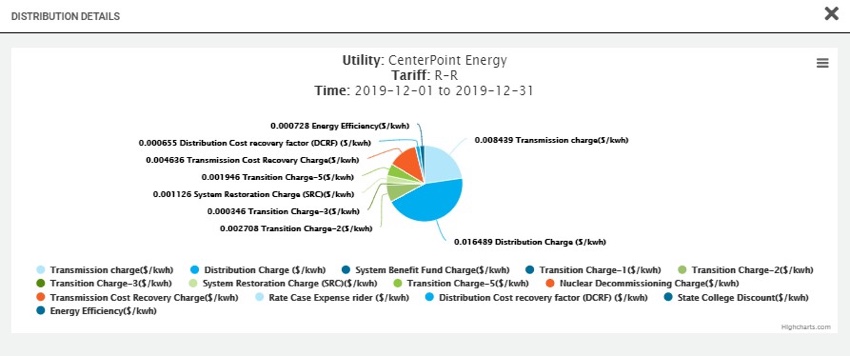
Distribution details for CenterPoint Energy’s R-R tariff in ERCOT.

Peak Demand Charges shown, December 19, 2019 at 4 PM CT, in Clarity Grid’s tariff analysis
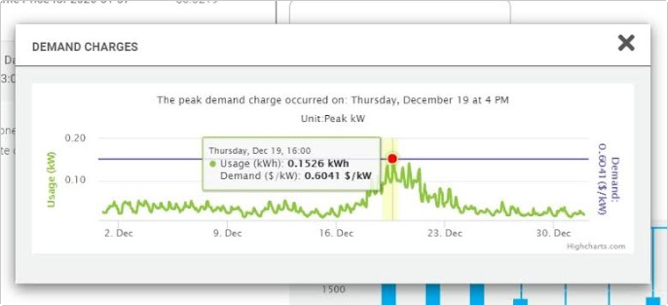
Clarity goes to the native public source for this level of tariff detail, typically the individual Utility’s website, to gather this data. Clarity uses these costs as well as hourly consumption and retail and wholesale pricing to construct something every electric consumer can recognize; a monthly bill. Clarity has in the past, dissected this monthly bill into four broad categories: a) Monthly Cost in $, b) Distribution in $/kwh, c) Demand in $/kw, and Energy in $/kwh. However, in response to requests from those who serve customers and large customers themselves, Clarity has now broken down each of these line-item costs into an easily readable pie chart on its platform (see below). In addition, hourly peak consumption is identified each month and the $/kw charge is displayed, see below. In this way, bill audit and energy management are made easier to accomplish for a customer in any zip code of the US!